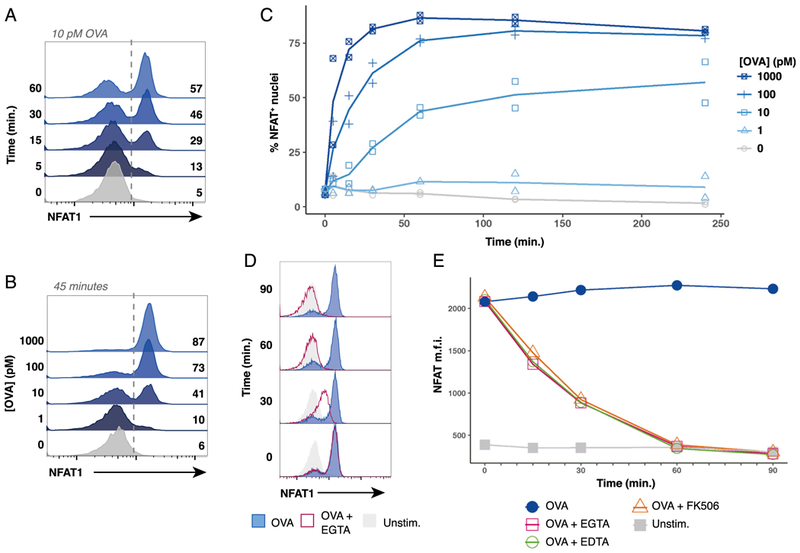
FIGURE 3. Peptide concentration controls digital NFAT1 nuclear translocation kinetics in a responder fraction of stimulated naive OT-I cells.

(A) Representative flow cytometry histograms displaying a timecourse of NFAT1 staining in OT-I nuclei after coculture with bulk splenocytes pulsed with 10 pM of OVA peptide. (B) Representative flow cytometry histograms of NFAT1-positive OT-I nuclei after 45 min of coculture with bulk splenocytes pulsed with indicated dose of OVA peptide. (C) Plots depicting compiled timecourse results from two experiments measuring NFAT1 localization in OT-I nuclei after coculture with bulk splenocytes pulsed with the indicated dose of OVA peptide. (D) Representative histograms of three experiments performed show that EGTA addition causes NFAT1 to exit OT-I nuclei. OT-I cells were cocultured with bulk splenocytes pulsed with 100 pM of OVA peptide. After stimulation for 30 min to allow for nuclear translocation of NFAT1, 5 mM EGTA was added to culture, and samples were harvested after 0,30, 60, or 90 min. (E) Line plots depicting median fluorescence intensity (m.f.i.) of NFAT1 in isolated OT-I nuclei stimulated similarly to (D). After 30 min of stimulation with OVA peptide, either 5 mM EDTA, 5 mM EGTA, or 100 nM FK506 was added to culture media where indicated. Samples were collected 0, 15, 30, 60, and 90 min after adding inhibitors. In (A)-(E), OT-I nuclei were identified as CellTrace Violethi β-tubulinlo
