. 2018 Jun 1;2(2):259–284. doi: 10.1162/netn_a_00040

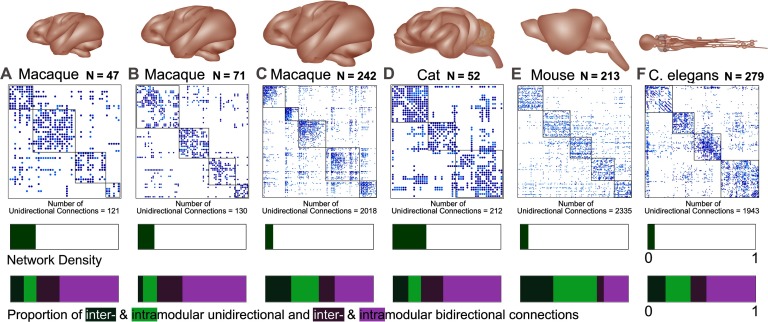
Figure 1. . The six connectomes analyzed in this study. Brain and connectome for three different parcellations of the macaque cortex (A) nodes N = 47 (Honey et al., 2007), (B) N = 71 (Young, 1993), and (C) N = 242 (Harriger et al., 2012), as well as three additional species including a (D) cat (Scannell et al., 1999), (E) mouse (Dong, 2008), and (F) C. elegans (White et al., 1986; Varshney et al., 2011). The connectomes represent connectivity matrices with rows and columns denoting brain regions (or nodes), and the elements within the matrices denoting the presence (filled) or absence (blank) of a connection between two regions. Unidirectional connections are highlighted in light blue (with the number of unidirectional connections stated below each connectome) and the nodal regions are arranged into modular communities. The bars below each connectome display the density of each network (A = 0.234, B = 0.15, C = 0.07, D = 0.308, E = 0.073, F = 0.063) and the proportion of unidirectional and bidirectional connections. The latter is segmented to display the proportion of unidirectional connections between modules (dark green: A = 0.123, B = 0.046, C = 0.238, D = 0.142, E = 0.304, F = 0.165) and within modules (light green: A = 0.117, B = 0.129, C = 0.255, D = 0.117, E = 0.404, F = 0.232) separately, as well as the proportion of bidirectional connections between modules (dark purple: A = 0.214, B = 0.236, C = 0.147, D = 0.21, E = 0.064, F = 0.147) and within modules (light purple: A = 0.547, B = 0.59, C = 0.359, D = 0.536, E = 0.229, F = 0.457).

Figure 1.