. 2018 Jun 1;2(2):259–284. doi: 10.1162/netn_a_00040

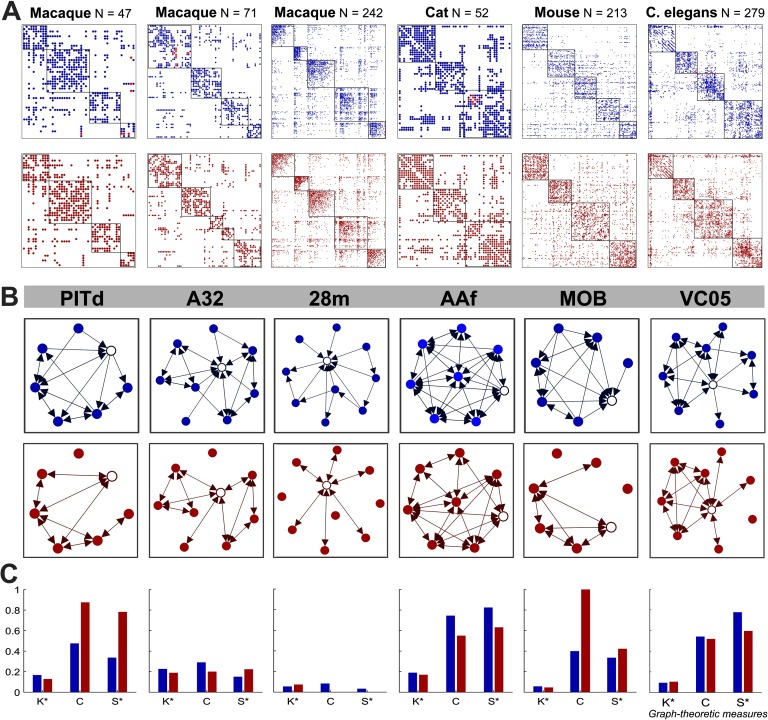
Figure 3. . Graph-theoretic measures for a specific region of interest from each empirical and density-preserving connectome. (A) Empirical (blue) and density-preserving (red, an illustrative single trial with 100% of unidirectional connections altered) connectomes. Nodal regions are arranged into modular communities and the connections connecting the region of interest to the rest of the network in the empirical connectome are colored red. (B) Labels for each region of interest (top), and subnetworks of the local neighborhood around each region of interest (white node). (C) Graph-theoretic measures at the selected brain region for the empirical and density-preserving networks. Graph-theoretic measures are as follows: K = degree, C = clustering coefficient, and S = small-world index (Si). *Normalized by the maximum value of that measure across all nodes in their respective network. PITd: dorsal posterior inferotemporal, A32: anterior cingulate area 32, 28m: medial entorhinal cortex, AAF: anterior auditory field, MOB: main olfactory bulb, VC05: ventral cord neuron 5.

Figure 3.