. 2018 Jun 1;2(2):259–284. doi: 10.1162/netn_a_00040

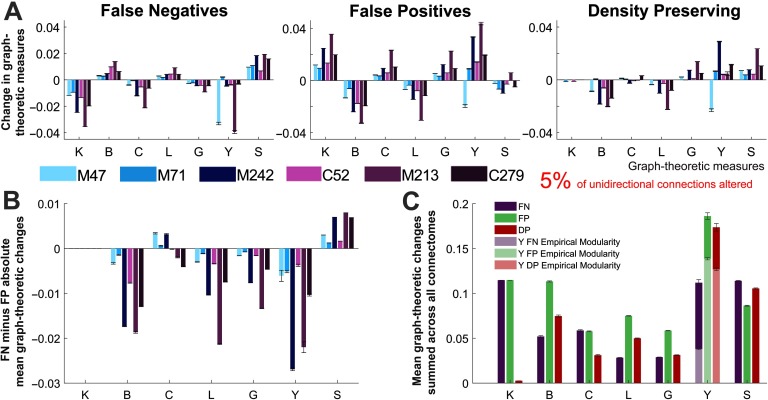
Figure 6. . Relative changes in mean graph-theoretic measures for perturbed networks. (A) Changes in mean graph-theoretic measures across all connectomes and each type of perturbed network. (B) Difference between the changes in mean graph-theoretic measures for the false negative and false positive networks. (C) Mean changes in graph-theoretic measures for each of the perturbed networks, summed across all connectomes. Two separate modularity inputs are used the participation index calculations for the perturbed networks: the consensus modularity of the empirical networks (light colors) and the new modularity assignments for each generated perturbed network (dark colors). (A–C) All results correspond to perturbed networks with 5% of randomly selected unidirectional connections modified. The results represent the mean of these networks over 50 trials, and describe the change in the mean graph-theoretic measure (from the empirical to perturbed network) normalized by the mean of the empirical network (error bars show the standard error of the mean). Graph-theoretic measures are as follows: K = degree, B = betweenness centrality, C = clustering coefficient, L = characteristic path length, G = global efficiency, Y = participation index, and S = small-world index (S, changes in this measure are presented as the mean over 1,000 trials). M47: the macaque connectome with 47 nodes, M71: macaque N = 71, M242: macaque N = 242, C52: cat, M213: mouse, C279: C. elegans.

Figure 6.