
Figure 4.
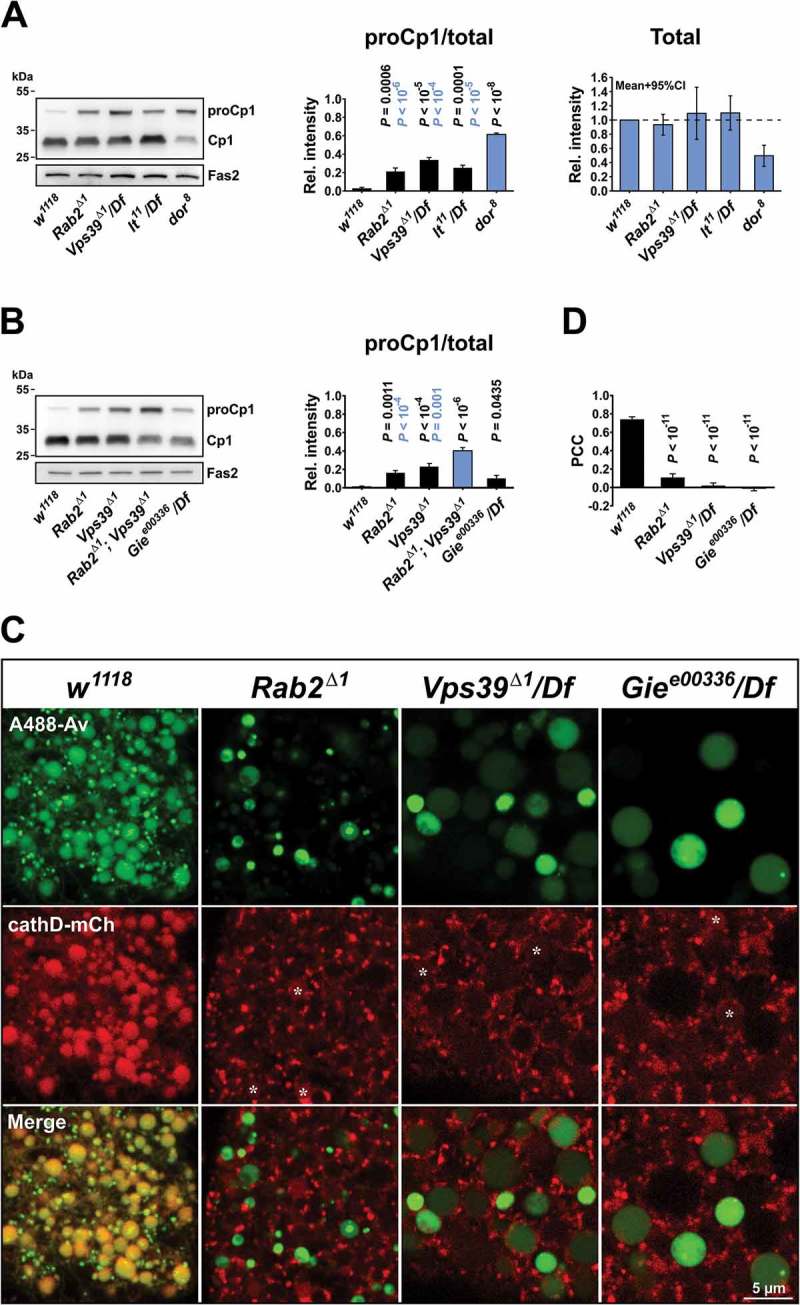
Processing of Cp1/Cath L and spatial dissociation between cathD and endolysosomal tracer in mutant garland cells. (A) Left, western blot of the CNS and attached tissues from L3 larvae of the indicated genotypes probed for endogenous Cp1/Cath L. Middle, Intensity of the pro-Cp1/Cath L immunosignal relative to the total Cp1/Cath L signal (i.e., both pro- and mature forms). P values in black and blue represent comparisons to w1118 and dor8, respectively. Right, Intensity of the total Cp1/Cath L signal relative to that of w1118. The mean and 95% confidence interval is shown. (B) Left, western blot of the CNS and attached tissues from L3 larvae of the indicated genotypes, probed for endogenous Cp1/Cath L. Right, Ratio of pro-Cp1/Cath L to total Cp1/Cath L as in (A), middle. P values in black and blue represent comparisons to w1118 and Rab2Δ1; Vps39Δ1, respectively. Quantifications in (A and B) are each based on 4 western blots and analyzed by ANOVA followed by Tukey HSD test. Fas2/Fasciclin II was used as loading control in (A and B). (C) Garland cells from larvae of the indicated genotypes expressing cathD-mCherry and pulsed with A488-avidin (3 min), then chased for 2 h. Confocal sections through the cortical cytoplasm of living garland cells are shown. Asterisks indicate low-level cathD-mCherry signal in the lumen of late endosomal vacuoles in Rab2, Vps39 and Gie/Arl8 mutants. (D) Quantification of the colocalization in (C), showing the Pearson correlation coefficient (PCC) for A488-avidin versus cathD-mCherry. Number of garland cell clusters analyzed: w1118, 5; Rab2Δ1, 5; Vps39Δ1/Df, 7; Gie e00336/Df, 10. ANOVA followed by Tukey HSD test.