
Figure 2.
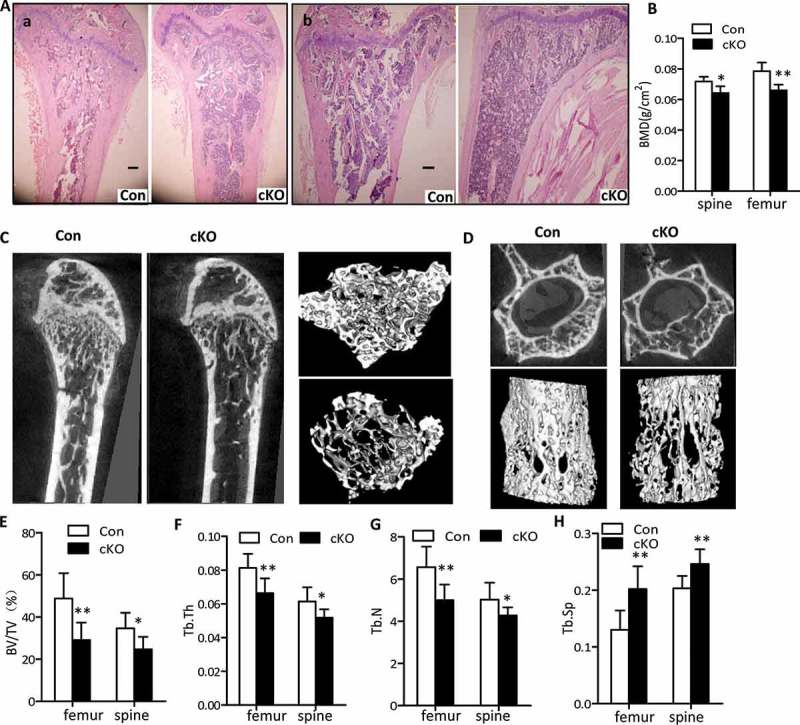
Lower bone density in osteoblast-specific Atg7 knockout mice at 22 wk. (a) H&E staining of femur (a) and tibia (b). Bars: 200 µm. (b) BMD was determined by μCT using lumbar (L4) and femur (n = 5 to 7/group). (c and d) Reconstructions of bone structure from μCT. Trabecular bone in femur (c) and lumbar vertebrae (L4) (d) are shown. Quantification of trabecular bone volume and architecture (n = 5 to 7/group): (e) BV/TV; (f) Tb.Th, trabecular thickness; (g) Tb.N, trabecular number; (h) Tb.Sp, trabecular spacing. *Statistically significant difference between control and cKO (mean ± SD, Student t test; *P < 0.05, **P < 0.01).