
Figure 3.
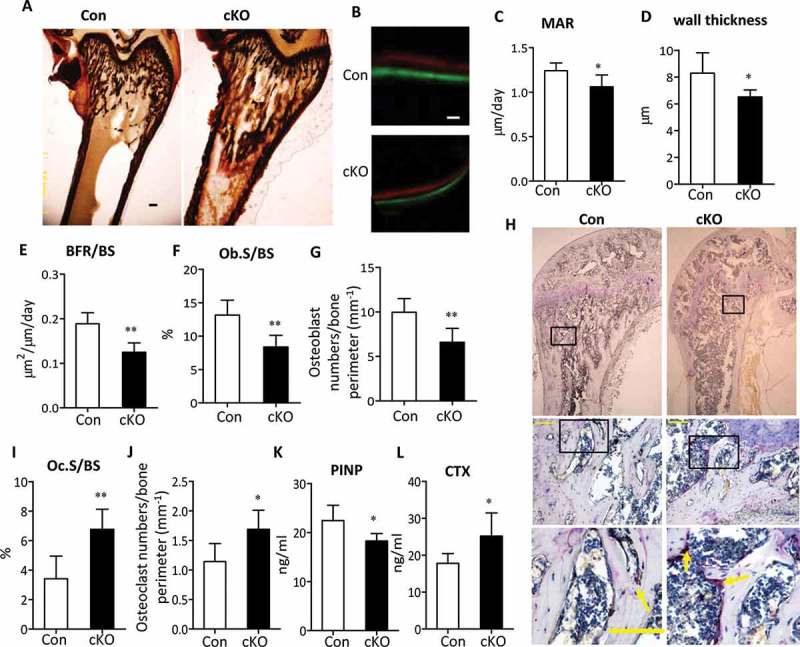
Decreased bone formation and increased bone resorption in Atg7 mutant mice. (a) Von Kossa staining of the distal femur sections of 3-wk Atg7 mutant (right) mice. Bars: 100 μm. (b) Representative Calcein and xylenol orange double-label staining images in femur sections (10 days apart between 2 labelings) of 22-wk-old male mice. Bars: 10 µm. Analysis of mineral apposition rate (MAR) (c), wall thickness (d), BFR/BS (e), Ob.S/BS (f) and Osteoblast numbers/bone perimeter (g) in 22-wk-old male animals. (h) Representative histological femur sections of 22-wk-old male mice stained for ACP5. Scale bars: 100 µm. Analysis of Oc.S/BS (i) and Osteoclast numbers/bone perimeter (j), and serum PINP and CTX levels (k and l) in 22-wk-old male animals. Data are presented as mean ± SD (n = 5 to 7/group, Student t test; *P < 0.05, **P < 0.01).