
Figure 5.
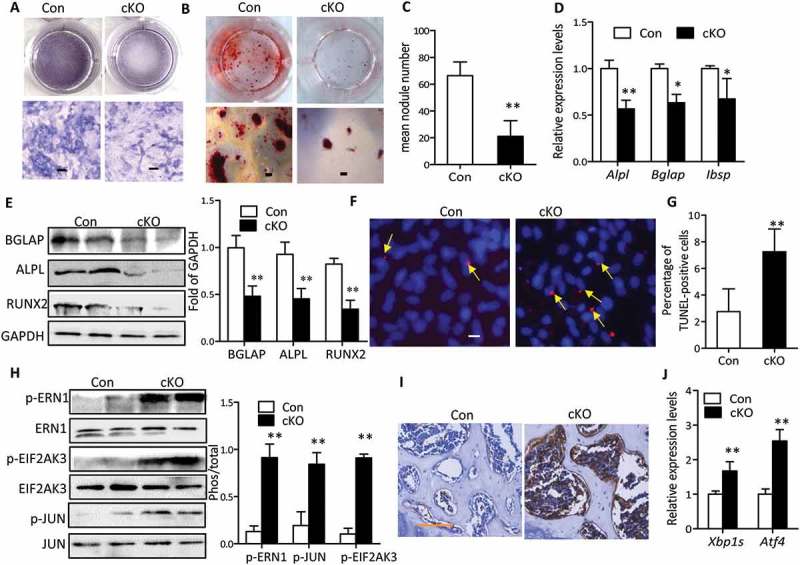
Autophagy deficiency inhibited osteoblasts mineralization and promoted apoptosis and ER stress. (a) Representative images for ALPL staining of primary osteoblasts derived from control and Atg7 cKO mice and cultured in differentiation medium for 7 days. Scale bars: 100 µm. (b) Representative images for Alizarin Red S staining of osteoblasts differentiated for 14 days. Scale bars: 200 µm. Statistical analysis of mineralization nodule numbers per well is shown in (c). (d) RT-qPCR for Alpl, Bglap, and Ibsp in primary osteoblasts differentiated for 14 days. (e) Representative western blot of BGLAP, RUNX2, and ALPL expression in primary osteoblasts induced for 14 days. Quantification is shown on the right. (f) Representative TUNEL labeling images of primary osteoblasts differentiated for 7 days. Bars: 10 µm. Statistical analysis of TUNEL-positive cell numbers is shown in (g). The data in (c to g) expressed as mean ± SD in each bar group represents the average of 3 independent experiments (Student t test; *P < 0.05, **P < 0.01). (h) Representative immunoblots of p-ERN1, p-JUN, p-EIF2AK3) in calvaria from 22-wk-old cKO mice (n = 3/group). Quantification is shown on the right (mean ± SD, Student t test; **P < 0.01). (i) Representative Immunohistochemical images of DDIT3 in tibia of 22-wk-old mice (n = 3/group). Scale bars: 100 µm. (j) Relative expression of Xbp1s and Atf4 mRNA in calvaria from 22-wk-old mice (n = 4 to 6/group) (mean ± SD, Student t test; **P < 0.01).