Figure 1.

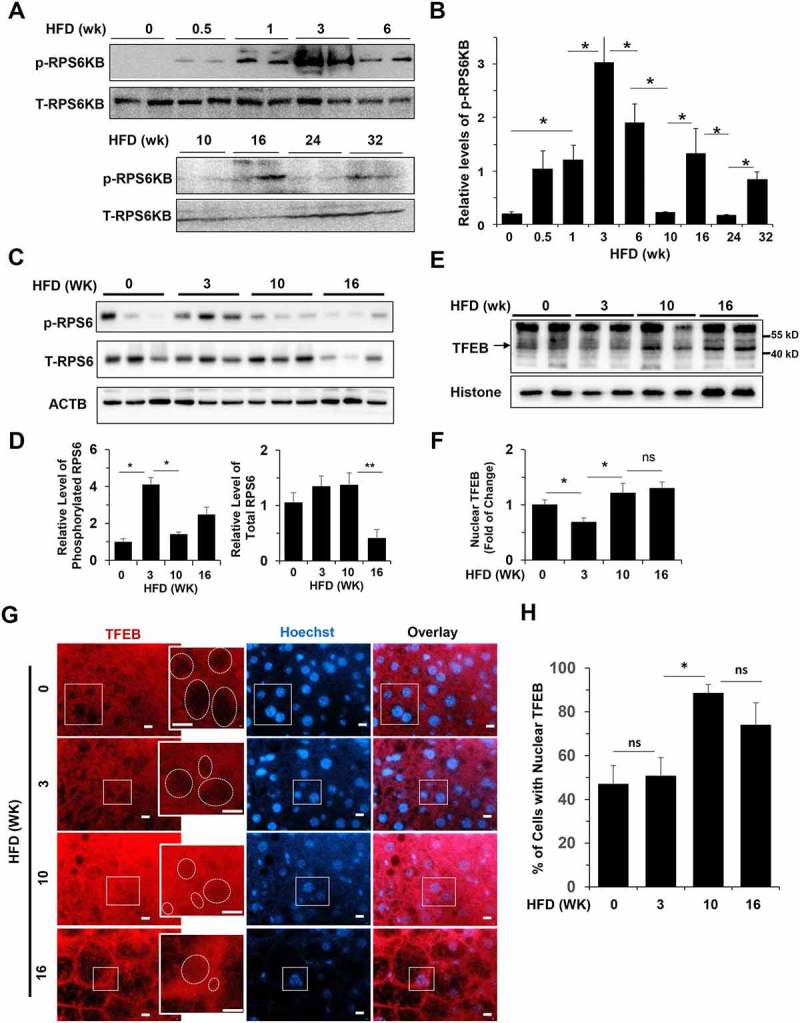
Activation of hepatic TFEB and RPS6KB oscillated in opposite directions in HFD-fed mice. (a-b) Levels of phosphorylated (p-RPS6KB) and total (T-RPS6KB) RPS6KB were determined in liver lysates prepared from mice fed with HFD for the indicated time. Each lane represents one sample (a). Densitometry analysis was performed for phosphorylated-RPS6KB, which was normalized to the level of total RPS6KB (b). (c-d) Levels of phosphorylated (p-RPS6) and total (T-RPS6) RP S6 were determined in liver lysates prepared from mice fed with HFD for the indicated time. Each lane represents one individual mouse (c). Densitometry analysis was performed for p-RPS6, which was normalized to the level of total RPS6, and total RPS6, which was normalized to the level of ACTB/β-actin (d). (e-f) The hepatic nuclear fraction prepared from mice fed with HFD for the indicated time was subjected to immunoblotting assay (e). Densitometry analysis was performed for TFEB, which was normalized to the level of histone (f). (g-h) Mice were fed with HFD for the indicated durations. Paraffin sections of liver tissue were stained with anti-TFEB and Hoechst 33328 (g). Boxed areas were enlarged in the insets, which illustrate the representative hepatocytes. Dotted circles indicate the nucleus, some of which were positive for TFEB signals. The percentage of cells with TFEB-positive nuclei was quantified (h). *, p < 0.05; **, p < 0.01; ns, not significant; n = 3–6 per group. Scale bar = 10 μm.
