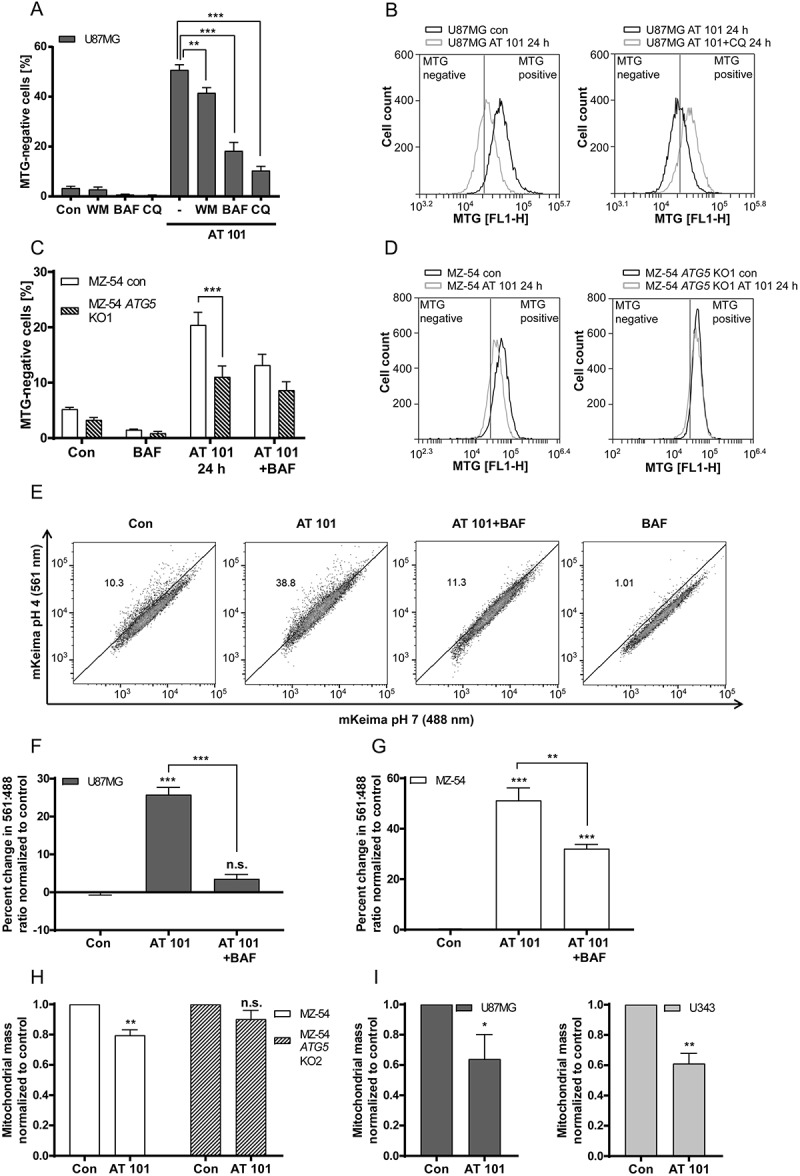
Figure 5.

Mitophagy induced by AT 101 is blocked by autophagy inhibition. (A, B) Quantification of MTG-negative cells by flow cytometric analysis (A) and exemplary measurements of MTG intensity by flow cytometry (B). U87MG cells were treated with AT 101 (15 µM) alone or in combination with bafilomycin A1 (BAF; 10 nM), wortmannin (WM; 100 nM) and chloroquine (CQ; 20 µM). Wortmannin was added to the cells 48 h before harvest and all other treatments were performed for 24 h. (C, D) AT 101 (15 µM) and/or bafilomycin A1 (BAF; 10 nM) was applied to the MZ-54 control and ATG5 KO cells for 24 h. The threshold for MTG-positive cells was set according to the control. DMSO was used as control (Con). Experiments A-D were repeated 3 times. Data are mean + SEM from n = 9–12 samples (5000–10,000 cells measured in each sample, 3–4 samples per experiment). (E-G) U87MG and MZ-54 cells stably expressing mito-mKeima were exposed to AT 101 (15 µM) in the presence or absence of bafilomycin A1 (BAF; 100 nM) or to DMSO (Con) for 6 h and subjected to flow cytometric analysis. (E) Representative experiment of U87MG cells. (F, G) Quantification of the changes in the mean value of the 561 nm:488 nm ratio, which corresponds to the pH where mKeima is located, normalized to control. Data represent mean + SEM of 3 replicates with 10,000 cells measured in each sample. (H, I) The glioma cell lines MZ-54 and MZ-54 ATG5 KO2 (H), U87 and U343 (I) were treated with 15 µM AT 101 for 30 h followed by q-RT-PCR in order to assess the mitochondrial mass determined as the ratio between the DNA levels of the mitochondrial gene MT-ND1 and the nuclear gene LPL. Experiments were repeated 3–4 times with 3 technical replicates. Data are mean + SEM from n = 3–4 samples.
