
Figure 6.
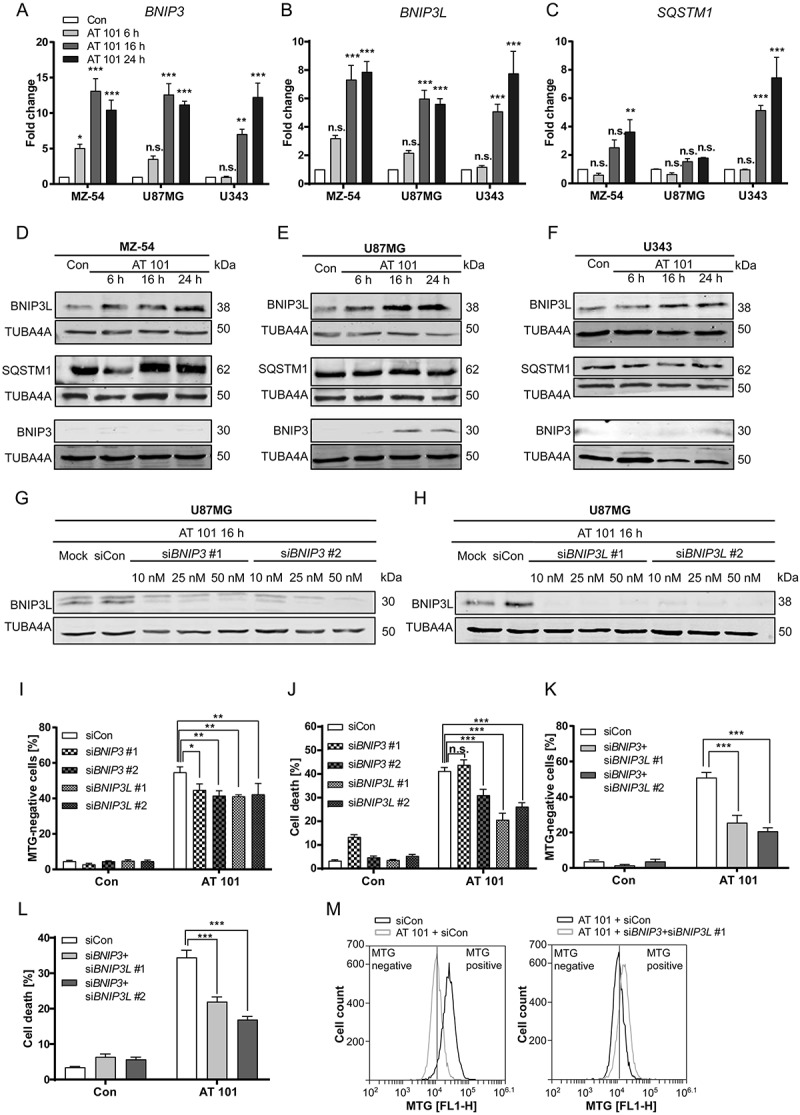
Investigation of mitophagy receptors. (A-C) Expression levels of BNIP3, BNIP3L and SQSTM1/p62 mRNA normalized to TBP. MZ-54, U343 and U87MG cells were treated with AT 101 (15 µM) for 6, 16 and 24 h or with DMSO for 24 h (Con). Experiments were repeated 3 times with 3 technical replicates. Data are mean + SEM from n = 3 samples. (D-F) Immunoblot analysis of BNIP3L, SQSTM1/p62 and BNIP3 protein expression in MZ-54 (D), U87MG (E) and U343 cells (F) upon AT 101 (15 µM) exposure for 6, 16, and 24 h or DMSO (Con) for 24 h. (G, H) Immunoblot analysis of U87MG cells treated with AT 101 (15 µM) for 16 h in the presence of siRNA against BNIP3 (siBNIP3 #1 or siBNIP3 #2; 10 nM, 25 nM, 50 nM) (G) and BNIP3L (siBNIP3L #1 or siBNIP3L#2; 10 nM, 25 nM, 50 nM) (H) or universal negative control (siCon). (I, K) Quantification of MTG-negative U87MG cells upon exposure to AT 101 for 24 h and siRNA against BNIP3 (siBNIP3 #1 or siBNIP3 #2; 25 nM) or BNIP3L (siBNIP3L #1 or siBNIP3L #2; 25 nM) (I) or a combination of BNIP3 and BNIP3L (siBNIP3 #1 and siBNIP3L #1 or siBNIP3 #2 and siBNIP3L #2; 25 nM each) (K) or universal negative control (siCon). (J, L) Cell death of U87MG cells was quantified by flow cytometric analysis of ANXA5/annexin binding and PI uptake after treatment with AT 101 (15 µM) for 48 h in the presence of siRNA against BNIP3 (siBNIP3 #1 or siBNIP3 #2; 25 nM) or BNIP3L (siBNIP3L #1 or siBNIP3L #2; 25 nM) (J) or a combination of BNIP3 and BNIP3L (siBNIP3 #1 and siBNIP3L #1 or siBNIP3 #2 and siBNIP3L #2; 25nM each) (L) or universal negative control (siCon). (M) Exemplary measurement of MTG intensity by flow cytometry. An amount of 25 nM siRNA was used for all experiments. Measurements were performed at least in triplicate. Data are mean + SEM from n = 9–12 samples (5000 – 10,000 cells measured in each sample, 3–4 samples per experiment).