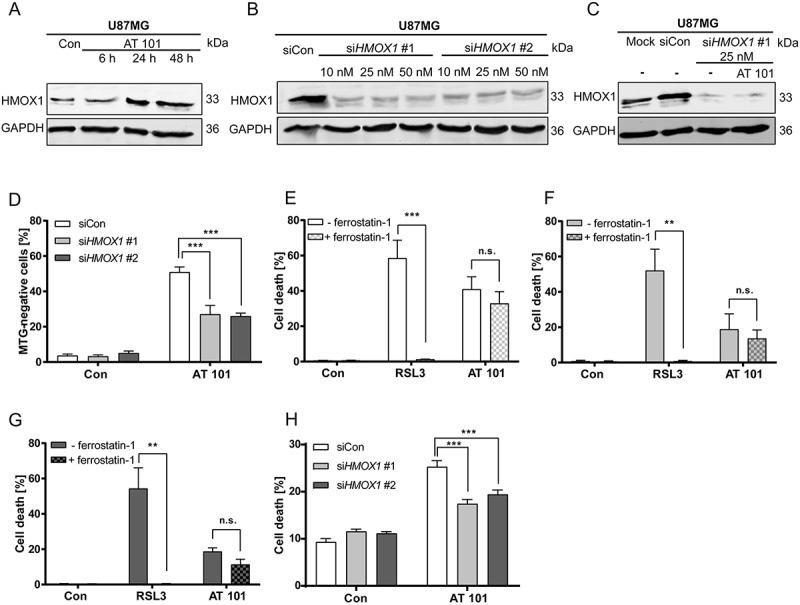
Figure 7.

HMOX1 triggers mitophagy, which is accompanied with increased cell death. (A) Immunoblotting analysis of HMOX1 expression in U87MG cells treated with AT 101 (15 µM) compared to control (Con). (B) Immunoblotting analysis of HMOX1 expression in U87MG cells treated with 2 different siRNAs against HMOX1 (siHMOX1 #1 and siHMOX1 #2; 10 nM, 25 nM, 50 nM) compared to siRNA universal negative control (siCon). (C) Immunoblotting analysis of HMOX1 expression in U87MG cells treated with AT 101 (15 µM) and/or siRNA against HMOX1 (siHMOX1 #1; 25 nM) compared to mock transfection and siRNA universal negative control (siCon). (D) Quantification of MTG-negative U87MG cells by flow cytometric analysis upon treatment with AT 101 (15 µM, 24 h) in the presence of 2 different siRNAs against HMOX1 (siHMOX1 #1 and siHMOX1 #2; 10 nM) compared to siRNA universal negative control (siCon). (E-G) Quantification of PI-positive cells of the cell lines MZ-54 (E), U343 (F) and U87MG (G) treated with 15 µM AT 101 or 500 nM RSL3 in the presence or absence of 5 µM ferrostatin-1. Cell death was assessed after 48 h (MZ-54, U343) or 72 h (U87MG) by PI and Hoechst-stained nuclei using fluorescence microscopy. Mean and SEM of 5–7 independent experiments performed in triplicate are shown. (H) Quantification of cell death by flow cytometric analysis of ANXA5/annexin binding and PI uptake after treatment with AT 101 (15 µM, 24 h) in the presence of 2 different siRNAs against HMOX1 (siHMOX1 #1 and siHMOX1 #2; 10 nM) or siRNA universal negative control (siCon). MTG and cell death measurements were repeated at least 3 times. Data are mean + SEM from n = 9–12 samples (10,000 cells measured in each sample, 3–4 samples per experiment).
