Figure 2.

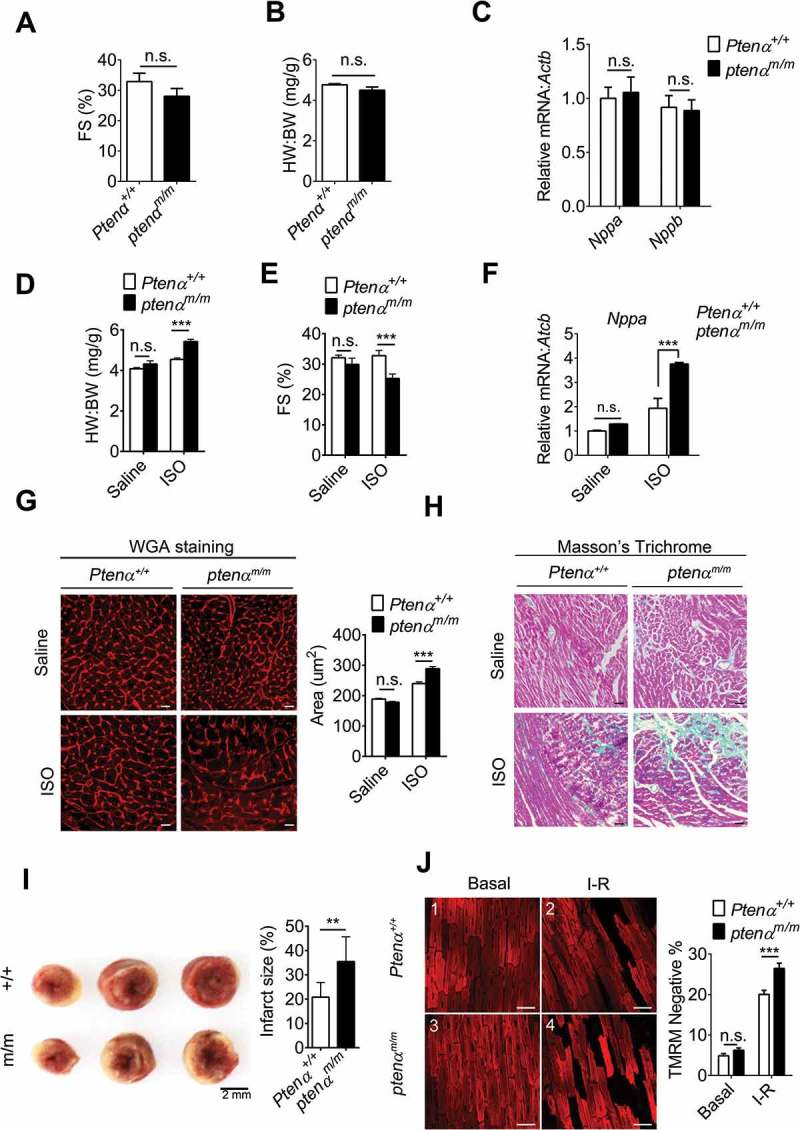
PTENα ablation aggravates ISO-induced hypertrophy. (a) Fractional shortening (FS) in 3-months-old mice (n = 8). Data are presented as mean ± SEM; n.s., not significant, p > 0.05; versus wild-type littermates (two-tailed paired Student’s t-test) (for raw data see Table S1). (b) Gravimetric analysis of heart weight: body weight ratio (HW: BW) of 3-months-old mice (n = 8). Data are presented as mean ± SEM; n.s., not significant, p > 0.05; versus wild-type littermates (two-tailed unpaired Student’s t-test). (c) mRNA levels of Nppa and Nppb measured with real-time PCR in 3-months-old Ptenα+/+and ptenαm/m mouse hearts (n = 4). Data are presented as mean ± SEM; n.s., not significant, p > 0.05; versus wild-type littermates (two-tailed unpaired Student’s t-test). (d) Gravimetric analysis of heart weight: body weight ratio (HW:BW) for saline- or ISO-treated Ptenα+/+and ptenαm/m mice (n = 4). Data are presented as mean ± SEM; ***p < 0.001 comparing Ptenα+/+, ptenαm/m ISO groups, analyzed by two-way ANOVA followed by Bonferroni’s multiple comparisons test. ANOVA F1, 12 = 27.6. (e) Fractional shortening (FS) in saline- or ISO-treated Ptenα+/+ and ptenαm/m mice (n = 4). Data are presented as mean ± SEM; ***p < 0.001 comparing Ptenα+/+, ptenαm/m ISO groups, analyzed with two-way ANOVA followed by Bonferroni’s multiple comparisons test. ANOVA F1, 12 = 9.18. (f) mRNA levels of Nppa measured with real-time PCR in saline- or ISO-treated Ptenα+/+ and ptenαm/m mouse hearts (n = 4). Actb was used as a loading control. Data are presented as mean ± SEM; ***p < 0.001 comparing Ptenα+/+, ptenαm/m groups, analyzed with two-way ANOVA followed by Bonferroni’s multiple comparisons test. ANOVA F1, 20 = 26.3. (g) (Left panel) Representative wheat-germ agglutinin (WGA) images from ventricular sections of saline- or ISO-treated Ptenα+/+ and ptenαm/m mouse hearts. Magnification: 40x; scale bars: 10 μm. (Right panel) Gravimetric analysis of area of cardiomyocytes, at least 40 cells from 6 fields for each genotype (n = 4). Data are presented as mean ± SEM; ***p < 0.001 comparing Ptenα+/+, ptenαm/m ISO groups, analyzed with two-way ANOVA followed by Bonferroni’s multiple comparisons test. ANOVA F1, 12 = 16.75. (h) Increased cardiac fibrosis highlighted with Masson’s trichrome staining in the ptenαm/m heart following ISO treatment. Magnification: 20x; scale bars: 20 μm. (i) TTC staining in I-R hearts. For I-R stress, hearts were subjected to 30 min of ischemia followed by 30 min of reperfusion. After I-R treatment, the heart was harvested and rinsed with saline. The tissue pieces were stained with 1% w:v TTC at 37 ºC for 30 min, followed by fixation in 4% formaldehyde overnight. The infarcted (white) area was analyzed with ImageJ software as a percentage of total area (n = 3). Data are presented as mean ± SEM; **, p < 0.01; versus wild-type littermates (two-tailed paired Student’s t-test). (j) Fluorescence microscopy of ∆ψm as shown by TMRM. Isolated Ptenα+/+ and ptenαm/m mice (3-months old) hearts were Langendorff-perfused with Tyrode’s solution. For I-R stress, hearts were subjected to 30 min of ischemia followed by 30 min of reperfusion. Magnification: 20x; scale bars: 50 μm. +/+, Ptenα+/+; m/m, ptenαm/m; I-R, ischemia-reperfusion. Statistical analysis of percentage of TMRM-negative area was calculated from 30 fields of 3 mice from each group. ***p < 0.001 comparing Ptenα+/+, ptenαm/m groups (p = 0.0008), analyzed with two-way ANOVA followed by Bonferroni’s multiple comparisons test. ANOVA F1, 60 = 16.6. I-R, ischemia-reperfusion.
