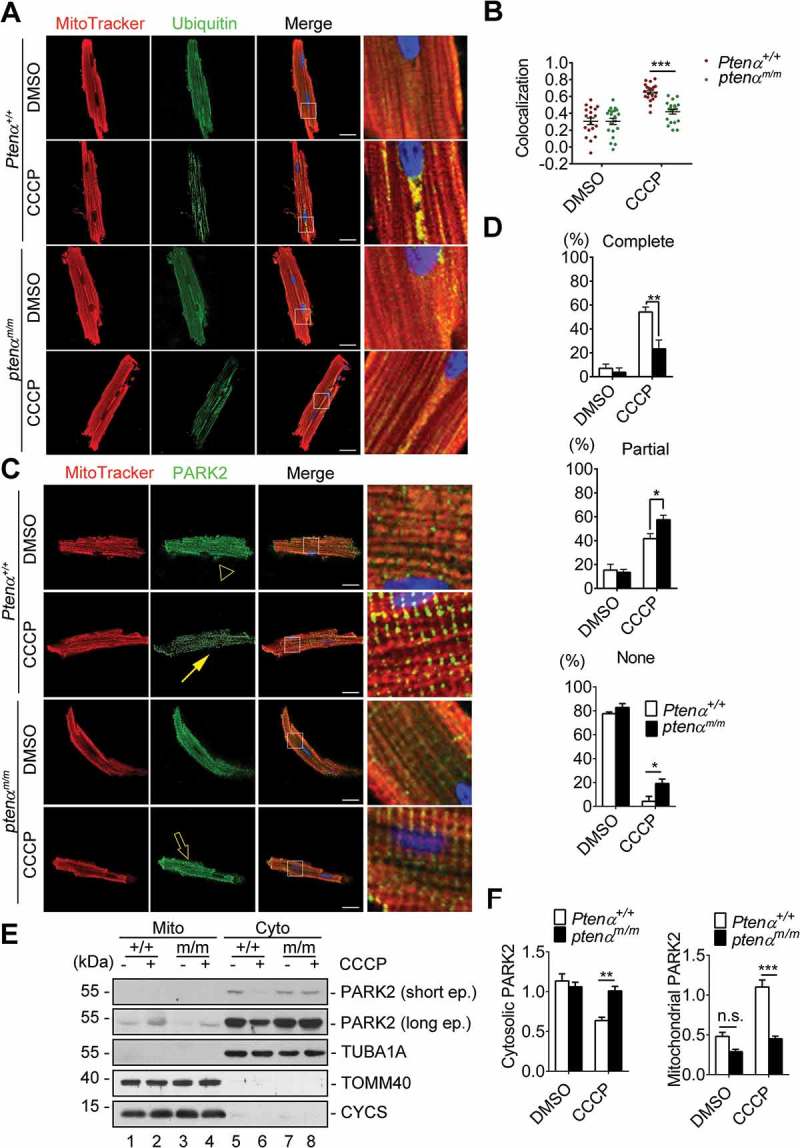
Figure 5.

Mitophagy is impaired in PTENα-deficient cardiomyocytes. (a) Representative confocal images of isolated cardiomyocytes from 4-months-old mice, labeled with MitoTracker Red and a ubiquitin antibody following treatment with DMSO or 1 μM CCCP. Magnification: 100x; scale bars: 20 μm. (b) Colocalization analysis of mitochondria and ubiquitin by Spearman’s rank correlation coefficient with Image software; n = 20 cells from 3 mice from each group were analyzed. Data are presented as mean ± SEM; ***p < 0.001 comparing Ptenα+/+, ptenαm/m groups, analyzed with two-way ANOVA followed by Bonferroni’s multiple comparison test. ANOVA F1, 76 = 13.5. (c) Representative confocal images of isolated cardiomyocytes from 4-months-old mice, labeled with MitoTracker Red and a PARK2 antibody following treatment with DMSO or 1 μM CCCP. Complete colocalization (arrow), partial colocalization (hollow arrow), and no colocalization (arrowhead) are shown. Magnification: 100x; scale bars: 20 μm. (d) Summary of PARK2 translocation in DMSO- or CCCP-treated Ptenα+/+ or ptenαm/m cardiomyocytes. 15 cells were used for percentage calculation for each condition according to the criteria in (A). Statistics were obtained from 3 independent experiments. Data are presented as mean ± SEM; *p < 0.05, **p < 0.01 comparing Ptenα+/+, ptenαm/m groups, analyzed by two-way ANOVA followed by Bonferroni’s multiple comparisons test. ANOVA F1, 8 = 9.481 in ‘Complete’; F1, 8 = 3.193 in ‘Partial’; F1, 8 = 11.86 in ‘None’. (e-f) Immunoblot analysis of PARK2 in mitochondrial and cytosolic fractions of isolated cardiomyocytes treated with DMSO or 1 μM CCCP from 3- or 4-months-old mice. Cyto, cytosolic fraction; Mito, mitochondrial fraction. TUBA1A is a cytosolic marker; TOMM40 and CYCS are mitochondrial markers. Mitochondrial and cytosolic PARK2 were quantified with ImageJ (n = 3). n.s., not significant, p > 0.05; **p < 0.01; ***p < 0.001 comparing Ptenα+/+, ptenαm/m groups, analyzed by two-way ANOVA followed by Bonferroni’s multiple comparisons test.
