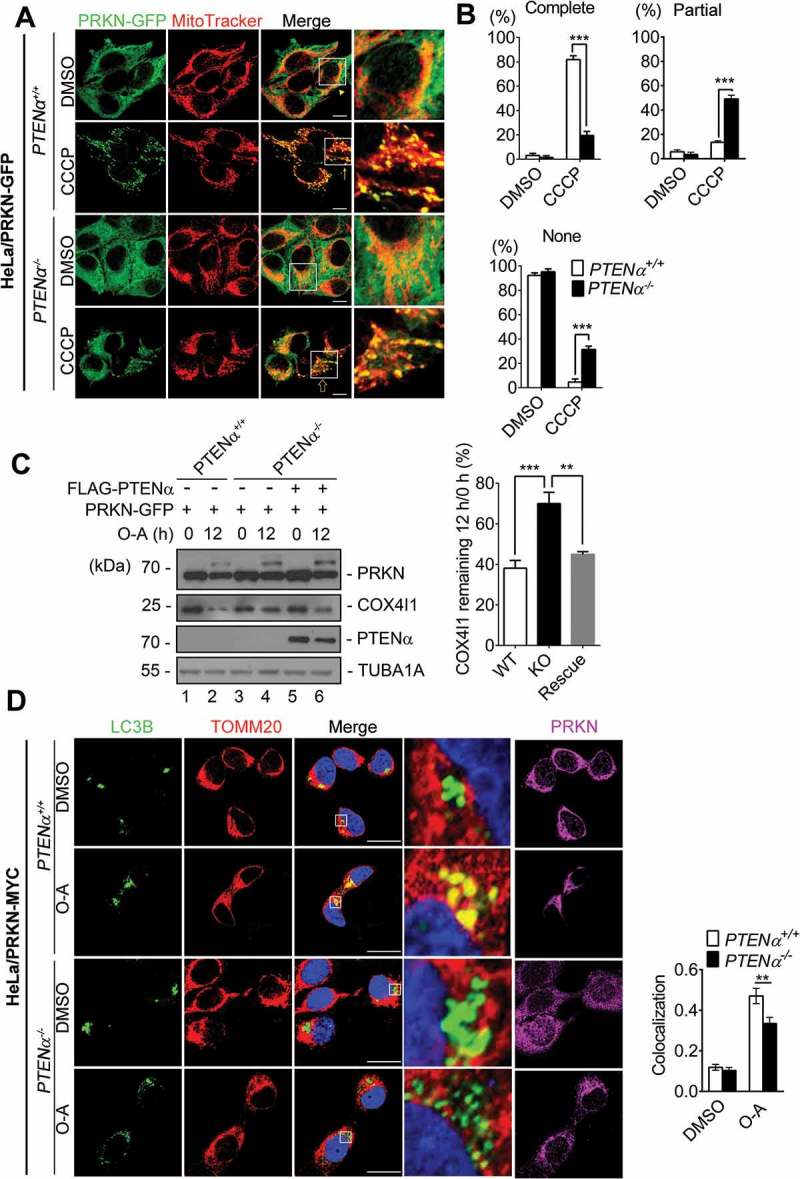
Figure 8.

PTENα promotes PRKN mitochondrial translocation and PRKN-mediated mitophagy. (a) CCCP induced PRKN translocation onto mitochondria in PTENα+/+ and PTENα-/- HeLa. Cells stably expressing PRKN-GFP were treated with 10 μM CCCP for 30 min. Colocalization of PRKN-GFP and mitochondria (MitoTracker Red) is indicated by yellow dots. Complete colocalization (arrow), partial colocalization (hollow arrow), and no colocalization (arrowhead) are indicated. Magnification: 100x; scale bars: 10 μm. (b) Summary of PRKN translocation in DMSO- or CCCP-treated PTENα+/+, PTENα-/- HeLa cells. Cells (20) from each condition were used for calculation of percentages according to the criteria in (A). Data were obtained from 3 independent experiments. Data are presented as mean ± SEM; ***p < 0.001 comparing PTENα+/+, PTENα-/- groups, analyzed by two-way ANOVA followed by Bonferroni’s multiple comparisons test. ANOVA F1, 8 = 36.38 in ‘Complete’; F1, 8 = 64.72 in ‘Partial’; F1, 8 = 156.9 in ‘None’. (c) COX4I1 degradation following O-A treatment. Plasmids encoding FLAG-PTENα and PRKN-GFP were co-transfected into PTENα+/+ or PTENα-/- HeLa cells. Cells were treated with 10 μM oligomycin and 4 μM antimycin A for 12 h and potential targets were evaluated by western blotting. Remaining COX4I1 protein levels were quantified with ImageJ (n = 3). **p < 0.01; ***p < 0.001 comparing PTENα+/+, PTENα-/- groups, analyzed with the paired Student’s t test. (d) O-A induced colocalization of GFP-LC3B with mitochondria. PTENα+/+ or PTENα-/- HeLa cells stably expressing PRKN-MYC were transfected with a plasmid encoding GFP-LC3B for 48 h, and treated with10 μM oligomycin and 4 μM antimycin A for 12 h. Magnification: 100x; scale bars: 20 μm. Colocalization analysis of mitochondria and GFP-LC3B with the Pearson correlation coefficient by ImageJ software. n = 17 cells from each group. Data are presented as mean ± SEM; ***p < 0.001 comparing PTENα+/+, PTENα-/- groups, analyzed by two-way ANOVA followed by Bonferroni’s multiple comparisons test. ANOVA F1, 64 = 18.9.
