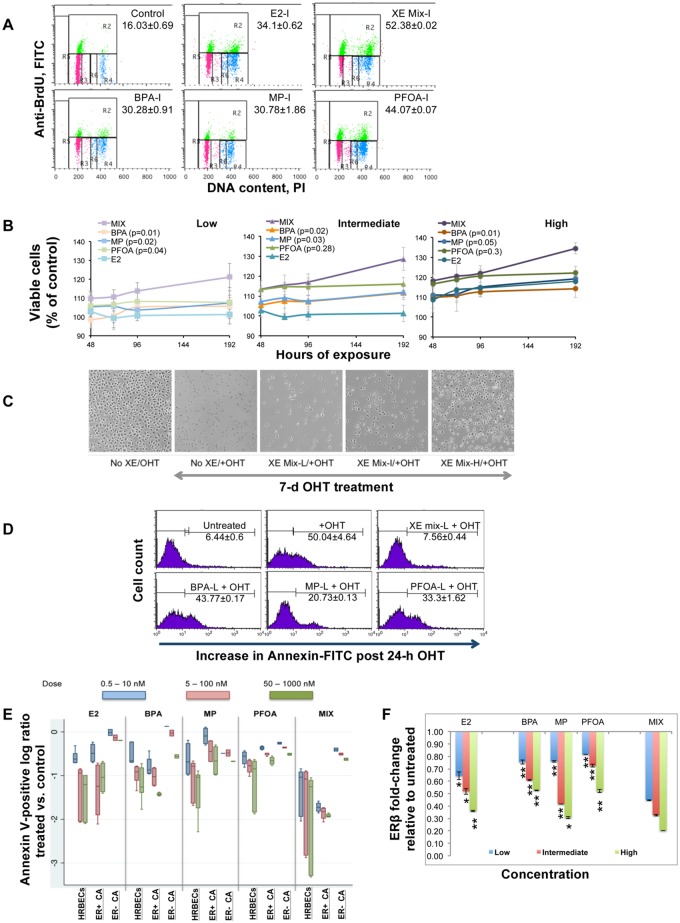
Figure 2.
Comparative effects of exposure to XE mixture vs. single components A, Cell cycle analysis measured by BrdU incorporation into DNA. FACS dot plots of representative HRBECs showing effects of treatment with single XEs or XE mixture at the intermediate (I) test concentration, a value that falls within the reported range of individual XEs detected in human body fluids. X-axis represents total DNA stained with PI. Y-axis represents BrdU-positive fraction. Values indicate percent S-phase (top—gate R2). Other phases of the cell cycle are also depicted as G1 (bottom left—gate R3) and G2M (bottom right—gate R4/R6). Each value represents 2–4 data points. Mixture induced S-phase increase relative to single XEs or E2 treatment is statistically significant (2-tailed p value < .001). B, A relative increase in the number of viable HRBECs in the presence of single XEs or XE mixture at low (BPA, PFOA—1 nM; MP—10 nM; XE mixture—1 nM BPA +1 nM PFOA +10 nM MP), intermediate (BPA, PFOA—10 nM; MP—100 nM; XE mixture—10 nM BPA +10 nM PFOA +100 nM MP), or high (BPA, PFOA—100 nM; MP—1 µM; XE mixture—100 nM BPA +100 nM PFOA +1 µM MP) concentrations, was measured over time (8-day treatment period) as relative fluorescence units of the PrestoBlue reagent. E2 treatment was included as a positive control. Each data point is an average of 6 replicates. A comparison of the slope b of each line in the plot for all 3 test concentrations shows a uniformly higher slope for mixture-treated cells compared with individual chemicals. Consistent with the higher b value, XE mixture treatment results in a significantly faster cell proliferation rate compared with single XEs at similar concentrations. The p-values of 2-tailed t tests comparing single XE and mixture are shown in each graph legend in parentheses.

