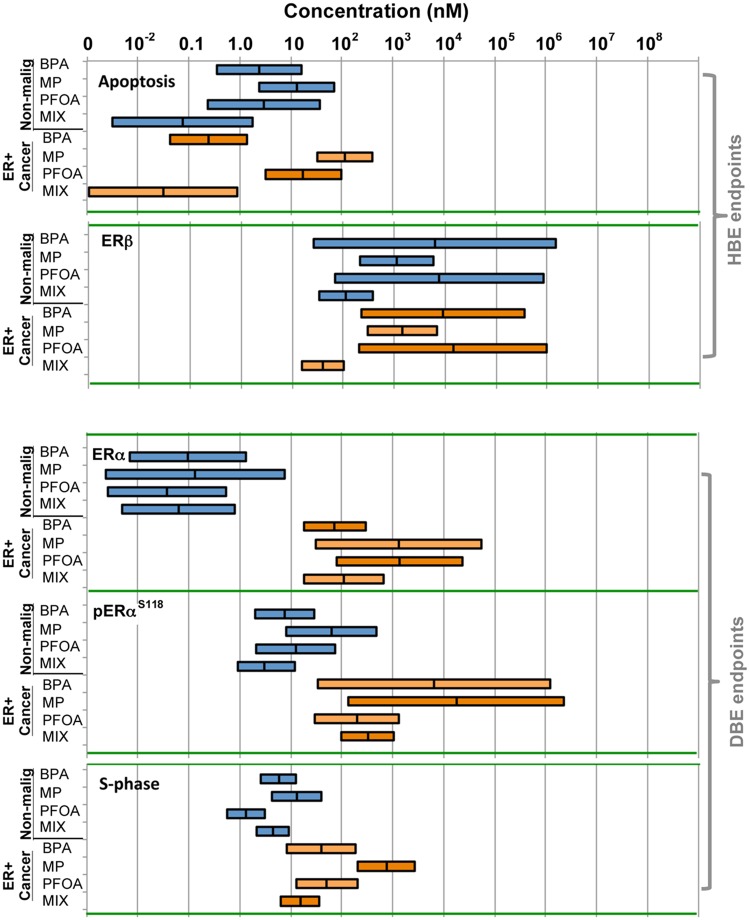
Figure 4.
Estimation of HBE and DBE levels of mixture versus single XEs—Plots based on cumulative response data for single XEs and ternary mixtures derived from 3 nonmalignant HRBECs and 2 ER-positive breast cancer cell lines for 5 independent cellular endpoints. The length of each horizontal bar represents the 95% CI for computing relative effects in the designated cell line group for a specific treatment and endpoint combination. For endpoints that were decreased in value by XE exposure relative to untreated controls (apoptosis and ERβ), the midpoint mark within the bar is the estimated HBE concentration where the endpoint is reduced to 50% of untreated control maximum. For endpoints where XE exposure led to an increased value relative to untreated controls (ERα, pERαS118, and S-phase), the midpoint mark within the bar is the DBE, an estimated concentration where the measured effect is double that of untreated control maximum. Within the collective data shown for each endpoint and cell group, a synergistic effect of the mixture is depicted wherever the HBE or DBE of the mixture bar does not overlap the HBE or DBE of the bar of any single chemical component, ie, mixture effects on apoptosis and ERβ in nonmalignant HRBECs, and on ERβ and S-phase in malignant cell lines.

