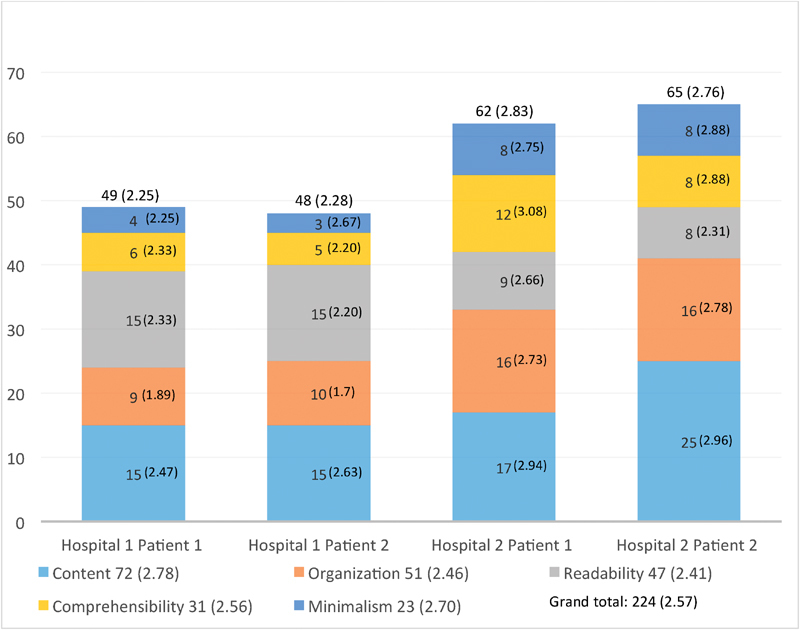
Fig. 3.

Results of heuristic evaluation. Number of usability issues and average severity ratings for each document, broken down by heuristic category. Total number of issues of each category across all documents and average severity ratings for these categories are shown in the legend. Average severity ratings for each category within each document are shown in parentheses in the relevant portion of each bar.
