
Figure 1.
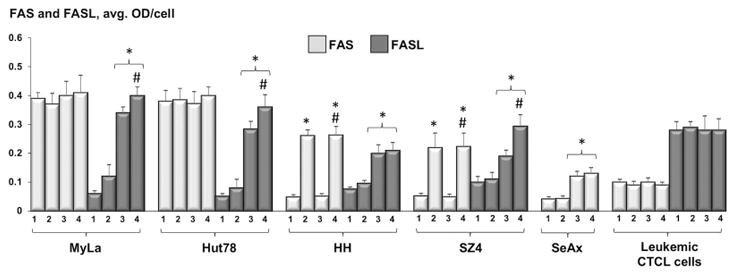
Quantitative analysis of FAS and FASL-expression in CTCL cell lines and leukemic CTCL cells: untreated samples (1), post 48h incubation with 100 nM MTX (2), 24 hours after standard PDT (3), and 24 hours following ePDT (4). * p < 0.05 as compared to untreated samples; # p < 0.05 relative to standard PDT.