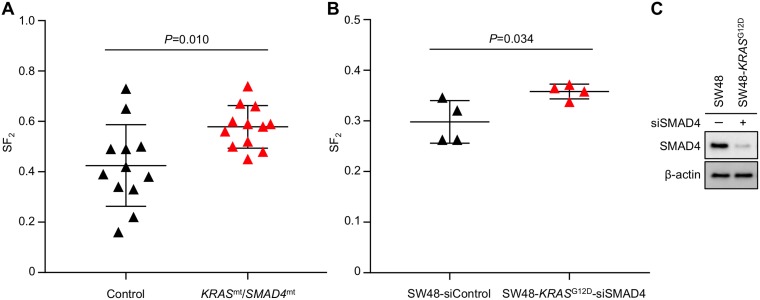
Figure 3. Higher SF2 is associated with simultaneous mutations in KRAS and SMAD4.
(A, B) SF2 values (assessed in a clonogenic assay) for 12 KRASmt/SMAD4mt and 12 Control cell lines (obtained from the literature) (A) and those for siControl-treated SW48 and siSMAD4-treated SW48-KRASG12D cells (experiments were performed in quadruplicate) (B). Bars denote the mean ± standard deviation (for details, see Acquisition of SF2 data from the literature in MATERIALS AND METHODS and Supplementary Table 6). (C) Immunoblots showing expression of SMAD4 and β-actin (as a loading Control) in siControl-treated SW48 and siSMAD4-treated SW48-KRASG12D cells.

