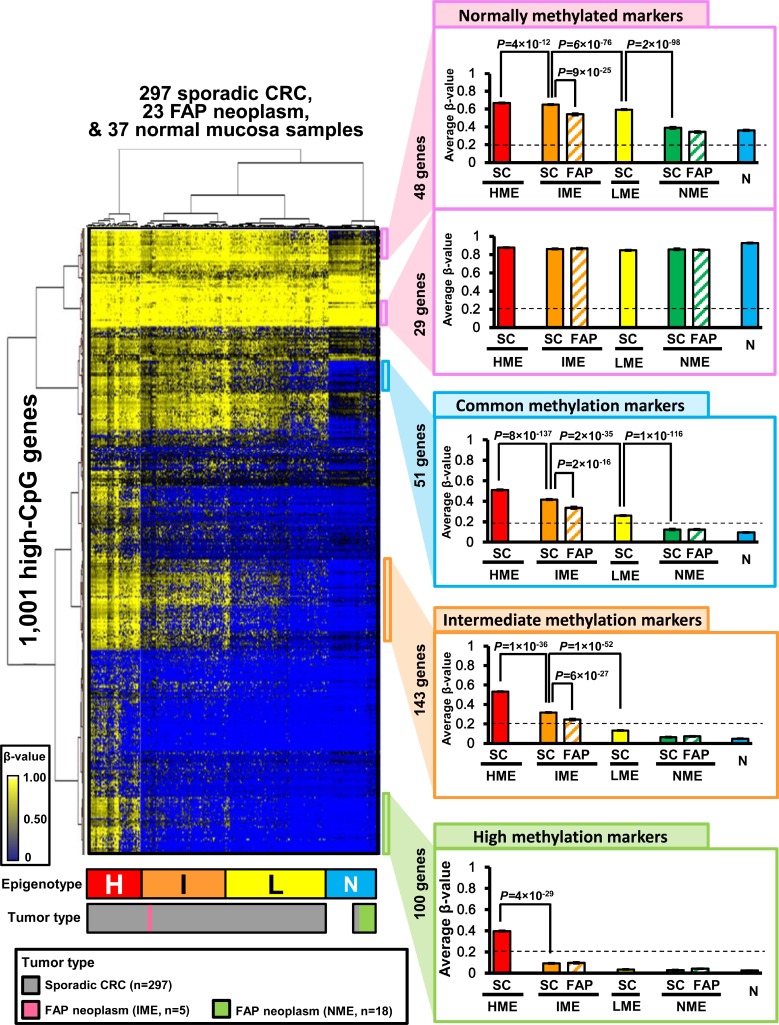
Figure 2. Hierarchical clustering analysis of FAP neoplasms, sporadic CRC, and normal mucosa samples.
Using unsupervised two-way hierarchical clustering analysis, 357 clinical samples were clustered into four methylation epigenotypes: high, intermediate, low, and normal-like methylation epigenotypes (H, HME; I, IME; L, LME; N, NME) (left panel). Methylation levels were compared among four epigenotypes using subgroups of genes (right panel). SC, sporadic CRC; FAP, FAP neoplasms; N, normal mucosa. Error bars show standard errors. Normally methylated markers are shown in the top panel, and commonly methylated markers are shown in the second from top panel. Intermediate methylation markers are shown in the third from top panel, and high methylation markers are shown in the bottom panel.

