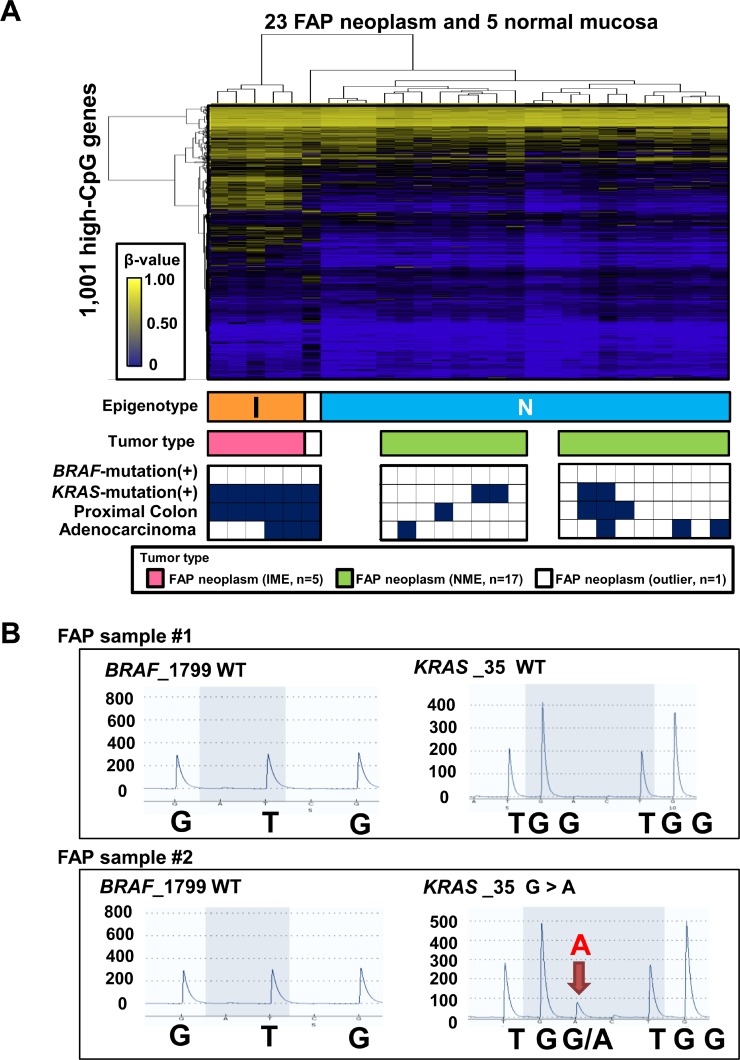
Figure 3. Characterization of 23 FAP neoplasms.
(A) Hierarchical clustering analysis of 23 FAP neoplasm samples and 5 normal mucosa samples without sporadic CRC. I, IME; N, NME. Bottom closed boxes indicate BRAF mutation (+) samples, KRAS mutation (+) samples, proximal colon samples, and adenocarcinoma samples. (B) Representative pyrograms for mutation analysis of BRAF and KRAS mutations. WT, wild-type.

