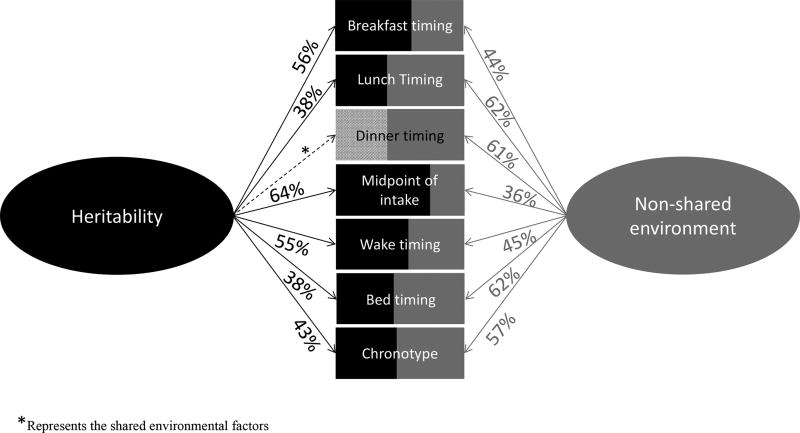
Figure 1.
Broad heritability and environmental effect estimates for food timing and related variables analyzed. The rectangles represent the contribution (percentage) of heritability (A: additive genetic factor + D: non-additive genetic factors) in black and non-shared environmental factors (E) in grey of the different variables. The asterisk represents the share environmental factors (C) in diagonals lines.

