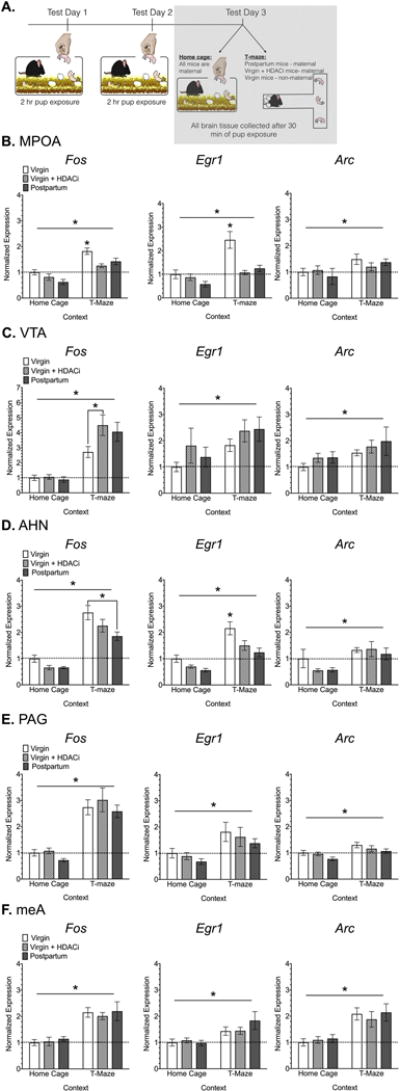
Figure 5. Immediate early gene expression in response to 30 min of pup exposure in the home cage or novel T-maze.

(A) Timeline for Experiment 3, the shaded box indicates the data that are shown in this figure. Normalized Fos, Egr1 and Arc mRNA expression in regions of the maternal (B-C) and defensive (D-F) neural pathways. Data are expressed as Mean ± SE. Abbreviations: AHN- anterior hypothalamic nucleus, MeA- medial amygdala, MPOA- medial preoptic area of the hypothalamus, PAG- periaqueductal grey, VTA- ventral tegmental area. Horizontal bars indicate a significant main effect of context. *Significantly different from all other groups in a particular context, unless otherwise noted with bars, Bonferroni adjusted p<0.05.
