
Figure 6. Immediate early gene expression in the home cage or novel T-maze in the absence of pups.
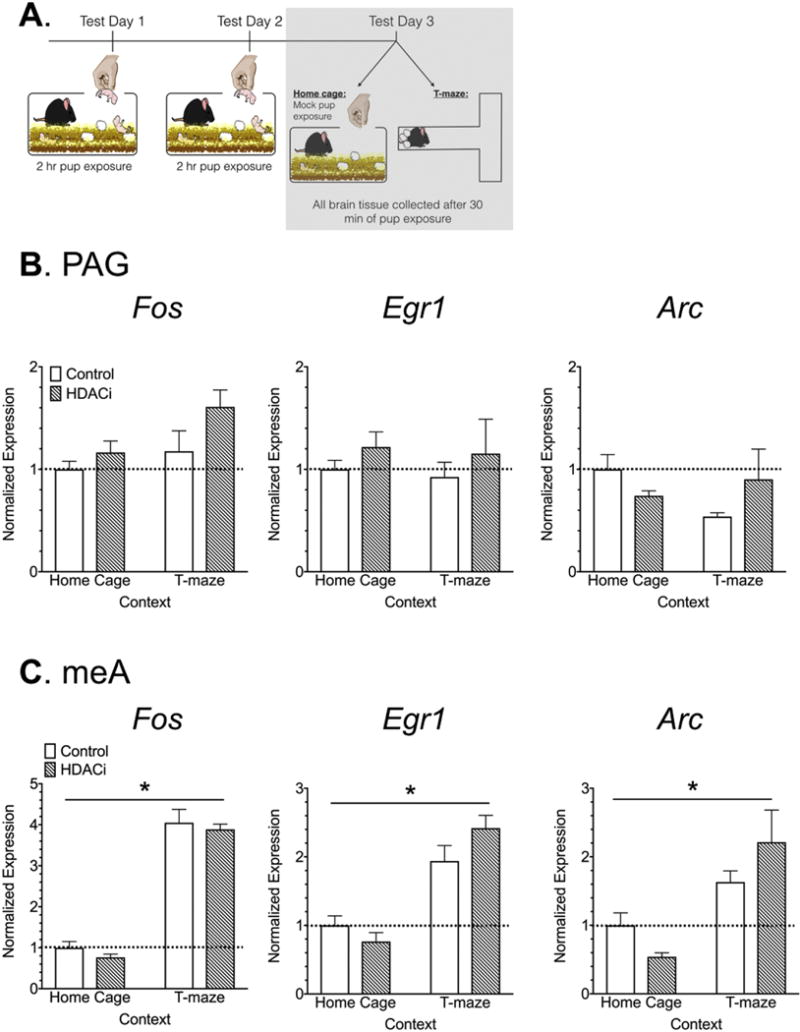
(A) Timeline for Experiment 4, the shaded box indicates the data that are shown in this figure. (B-C) Normalized Fos, Egr1 and Arc mRNA expression in the PAG and meA. Data are expressed as Mean ± SE.