Fig. 2.

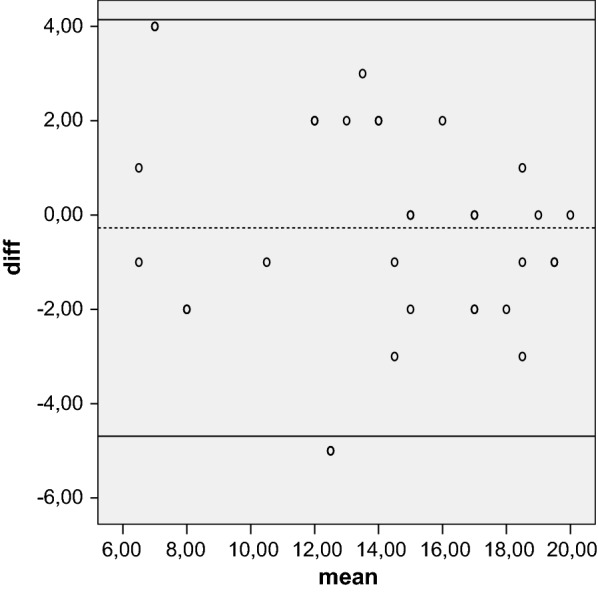
Bland–Altman plot showing test–retest results for 33 patients completing the Italian version of the Larsen index. The dashed line shows the mean difference; solid lines show the 95 % confidence interval

Bland–Altman plot showing test–retest results for 33 patients completing the Italian version of the Larsen index. The dashed line shows the mean difference; solid lines show the 95 % confidence interval