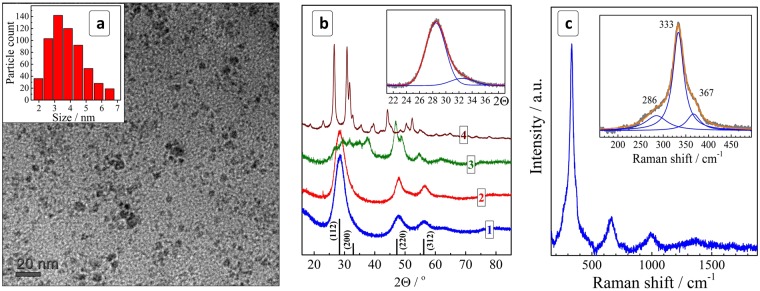
Figure 1.
(a) TEM image and size distribution of CZTS NCs. (b) X-ray diffractograms of CZTS NCs (curve 1) as well as Cu-Sn-S (2), Cu-S (3), and Sn-S (4) samples produced under the same conditions. Black vertical lines show the positions of bulk kesterite diffraction peaks with corresponding face indices (JCPDS No. 26-0575). Inset: fitting of the (112/200) peak range with two Gauss profiles. (c) Raman spectrum of unfractionated CZTS NCs. Insert: fitting of a section of the first-order phonon range with a set of three Lorentz profiles.

