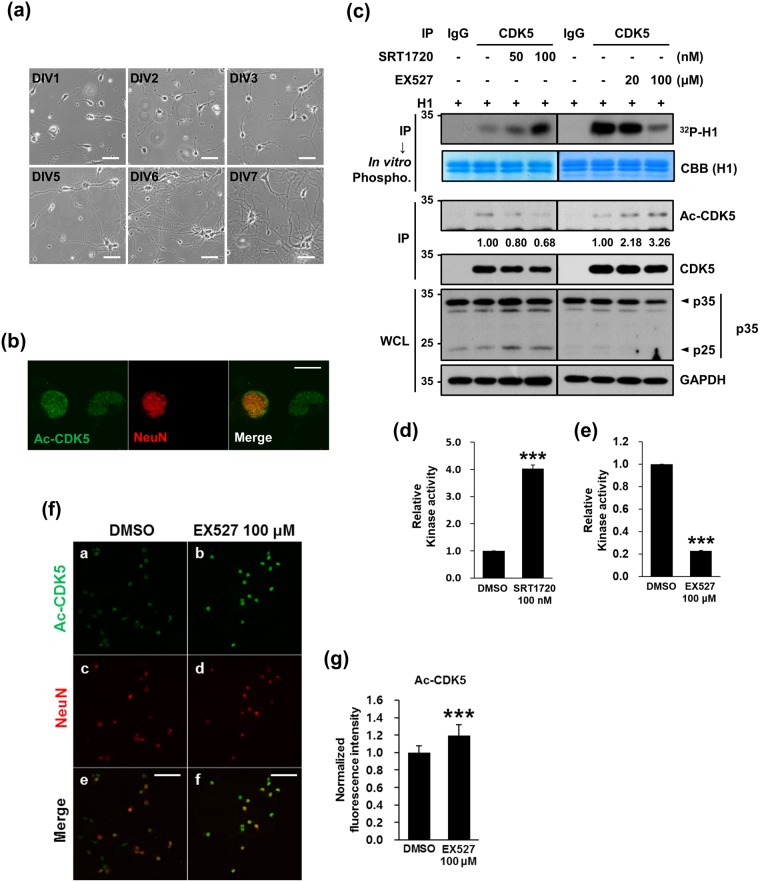
Figure 5.
Pharmacological modulation of SIRT1 affects Ac-CDK5 levels and kinase activity in hippocampal neurons. (a) Primary cultures of hippocampal neurons were prepared from rat hippocampi isolated in gestational day 18. At the indicated days in vitro (DIV), photomicrographs were captured with an Axiovert 100. The scale bar represents 50 μm. (b) Cultured hippocampal neurons at DIV5 were fixed and immunostained with an anti-Ac-CDK5 antibody and an anti-NeuN antibody (a neuronal nuclear marker) followed by incubation with appropriate fluorescence-tagged secondary antibodies. Fluorescent images were obtained with an LSM700 confocal microscope. The scale bar represents 10 μm. (c) Hippocampal neurons at DIV3 were treated with SRT1720 or EX527 at the indicated doses for 48 hrs. Immunoprecipitates of cellular lysates purified with an anti-CDK5 antibody or IgG were subjected to IB with an anti-CDK5 antibody or an in vitro phosphorylation assay in the presence of H1 and [γ-32P]ATP. Phosphorylated H1 signals were visualized by autoradiography. After normalization to H1 or CDK5, the relative intensities of phospho-H1 and Ac-CDK5 were calculated over the controls (value = 1) and are indicated at the bottom of the blot. WCLs were subjected to IB with the indicated antibodies. (d,e) The relative kinase activity of CDK5 was expressed as the fold change over the control (value = 1) in the presence of (d) SRT1720 or (e) EX527. The bar represents the mean ± S.D from 4 independent experiments. ***p < 0.001. (f) Hippocampal neurons at DIV3 were treated with EX527 at 100 μM for 48 hrs, fixed, and then processed for immunofluorescent staining as described in (b). The scale bar represents 50 μm. (g) The fluorescence intensity of Ac-CDK5 in the nuclei of NeuN-positive neurons was measured using Image-J software. The relative fluorescence intensity was expressed as the fold change over the control (value = 1). The bars represent the mean ± S.D of 35 neurons from at least 5 randomly selected areas. ***p < 0.001.

