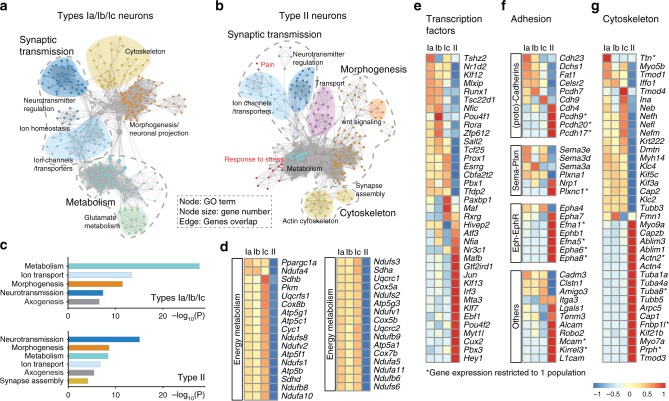
Fig. 2.
Comparative analysis of SG neurons transcriptomes. a, b Gene set enrichment analysis of types I (a) and type II neurons (b) visualized by network. Each node represents a GO term, edges are drawn when there are shared genes between two GO terms. c Gene ontology analysis of the type I and type II group. The graph shows most significant terms reflecting neuronal features. d Heatmaps showing expression of genes associated with energy metabolism in each subclass of SG neurons. e–g Differential expression of transcription factors (e), cell-adhesion molecules including Cadherin, Semaphorin, and Ephrin family (f) and of cytoskeleton-related genes among the four subclasses of SG neurons (g) (see also Supplementary Fig. 2)

