Fig. 4.
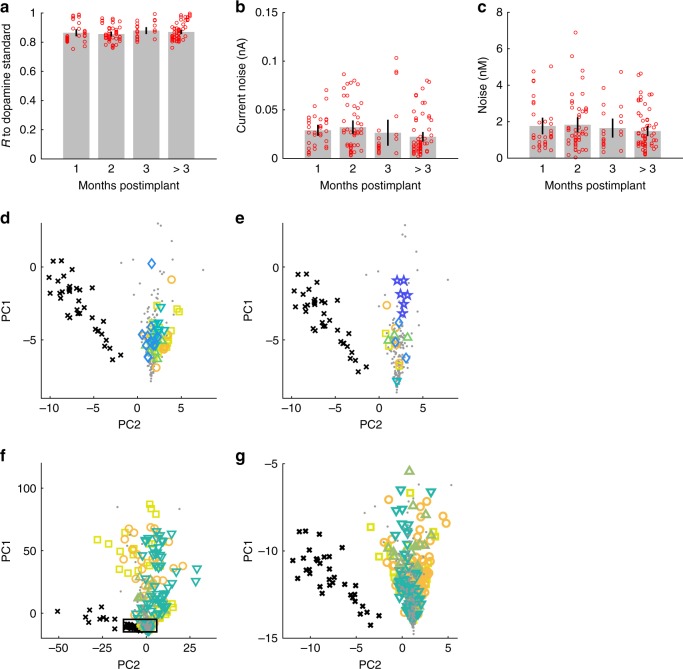
Long-term performance of measurements by µIPs and fidelity of detected signals. a Pearson’s correlation coefficients (R) of cyclic voltammograms recorded in vivo to in vitro dopamine standards, computed from 188 recordings from 8 probes in four rats at all chronic time points and for the same stimulation parameters as in Fig. 3e, plotted over periods of 1, 2, 3, and >3 months postimplant. R > 0.75 for all chronically recorded signals, and these correlations are maintained over time. b Current noise of measured signals. c Dopamine concentration noise of measured signals (as extracted from data presented in b by PCA) demonstrating an average LOD of 5.7 nM (mean noise × 3). Error bars represent 95% confidence intervals. d–g Principal component scores (PC1 and PC2) of recorded in vivo signals (colored shape signals; same data source as presented in a–c) as measured at 24 (⎕), 37 (○), 51 (▵), 56 (∇), and 107 days (◊) postimplant for probe c172 (d), and at 14 (⎕), 43 (○), 64 (Δ), 100 (∇), 129 (◊), and 212 days (☆) postimplant for probe c123 (e), and at 1 (⎕), 2 (○), 3 (Δ), and greater than 3 months (∇) for all implanted probes (eight probes in four rats) (f). Measurements are overlaid with scores from dopamine (•) and pH (×) standards as taken from 96 in vitro measurements from three probes. In vivo principal component scores demonstrate tight correspondence between measured cyclic voltammograms and the dopamine standards with a clear separation from the pH cyclic voltammograms, indicating clear distinction to pH interferants. The close-up (g) of the outlined area in f shows separation between group of pH scores and all measured cyclic voltammograms that closely overlay with the dopamine standards

