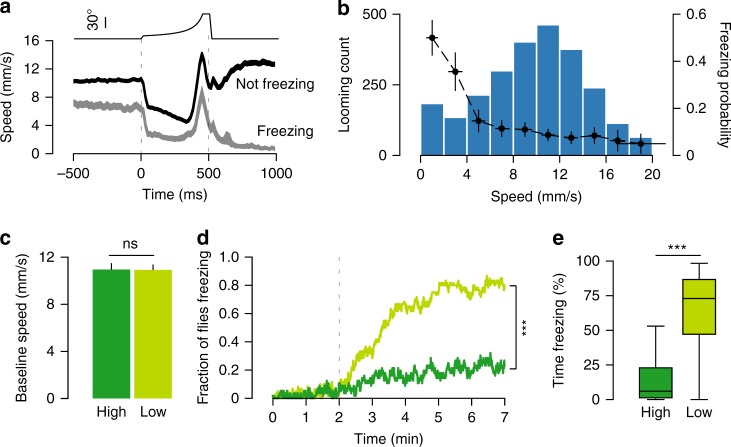
Fig. 4.
Response to looming is modulated by walking speed. a Looming-triggered speed profile (average ± s.e.m.) including only transition trials where flies were not freezing before the stimulus (n = 2501 loomings), separated into events that led to freezing (light gray, n = 346) and events that did not (dark gray, n = 2155). b Distribution of fly speed 500 ms before loomings where flies were not freezing (blue bars, n = 2501 loomings) overlaid with the probability of freezing after the stimulus for each speed interval (black dots and trace). X-error bars shows standard deviation (s.d.) for speed sampled within each interval and Y-error bars show 95% confidence intervals (CI). a, b Show data from the experiment in Figs. 1–3, whereas panels c–e show data from closed-loop experiments. In c–e, dark green corresponds to high speed (n = 56) group and light green to low speed group (n = 60). c Average + s.e.m. speed during baseline period for high and low speed groups. d Proportion of freezing flies. Dashed line indicates onset of stimulation. e Percent time spent freezing during stimulation period. *** denotes p < 0.001, ns not significant. Box plot elements: center line, median; box limits, upper (75) and lower (25) quartiles; whiskers, 1.5× interquartile range

