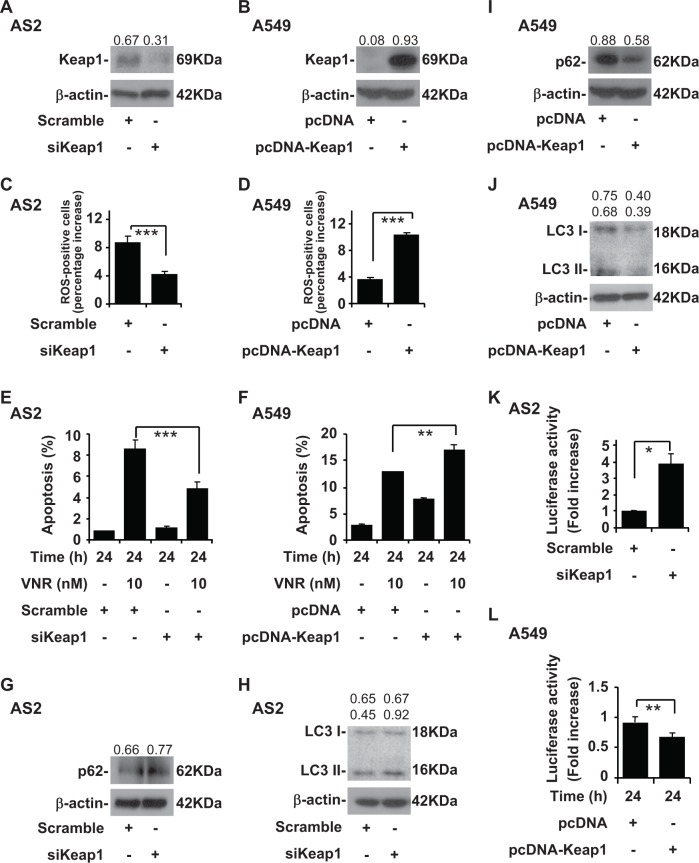
Fig. 4. Keap1 regulates autophagy activity followed by ROS level and VNR-induced apoptosis in the AS2 and A549 cells.
a A representative western blot analysis showing the expression of Keap1 in the AS2 cells with or without the transfection of plasmids containing siKeap1. β-actin was used as an internal control. The relative densities of the measured protein bands are also shown. b A representative western blot analysis showing the expression of Keap1 in the A549 cells with or without the transfection of plasmid expressing pcDNA-Keap1, where pcDNA was used as a vector control. c CM-H2DCFDA staining, followed by a flow cytometric analysis, was used to determine the levels of ROS in the AS2 cells with or without the transfection of plasmids containing siKeap1. For the flow cytometric analyses, the percentages are the means ± SDs of three individual experiments. ***P < 0.001. d CM-H2DCFDA staining, followed by a flow cytometric analysis, was used to determine the levels of ROS in the A549 cells transduced with pcDNA and pcDNA-Keap1. For flow cytometric analyses, the percentages are the means ± SDs of three individual experiments. ***P < 0.001. e Nuclear PI staining and a subsequent flow cytometric analysis determined cell apoptosis in the VNR-treated AS2 cells with or without the transfection of plasmids containing siKeap1. The percentages (%) of apoptotic cells are shown as the means ± SDs of three individual experiments. ***P < 0.001. f Nuclear PI staining and a subsequent flow cytometric analysis determined cell apoptosis in the VNR-treated A549 cells transduced with pcDNA and pcDNA-Keap1. The percentages (%) of apoptotic cells are shown as the means ± SDs of three individual experiments. **P < 0.01. A representative western blot analysis showing the expression of p62 (g) and LC3 I and II (h) in the AS2 cells with or without the transfection of plasmids containing siKeap1. β-actin was used as an internal control. The relative densities of the measured protein bands are also shown. A representative western blot analysis showing the expression of p62 (i) and LC3 I and II (j) in the A549 cells transduced with pcDNA and pcDNA-Keap 1. k The luciferase activity analysis showing the expression antioxidant response element of in AS2 with or without the transfection of plasmids containing siKeap1. The mean luciferase activity (fold increase) of each stain is shown as the means ± SDs of three individual experiments, *P < 0.05. l The luciferase activity analysis showing the expression antioxidant response element of in A549 transduced with pcDNA and pcDNA-Keap1. The mean luciferase activity (fold increase) of each stain is shown as the means ± SDs of three individual experiments, **P < 0.01

