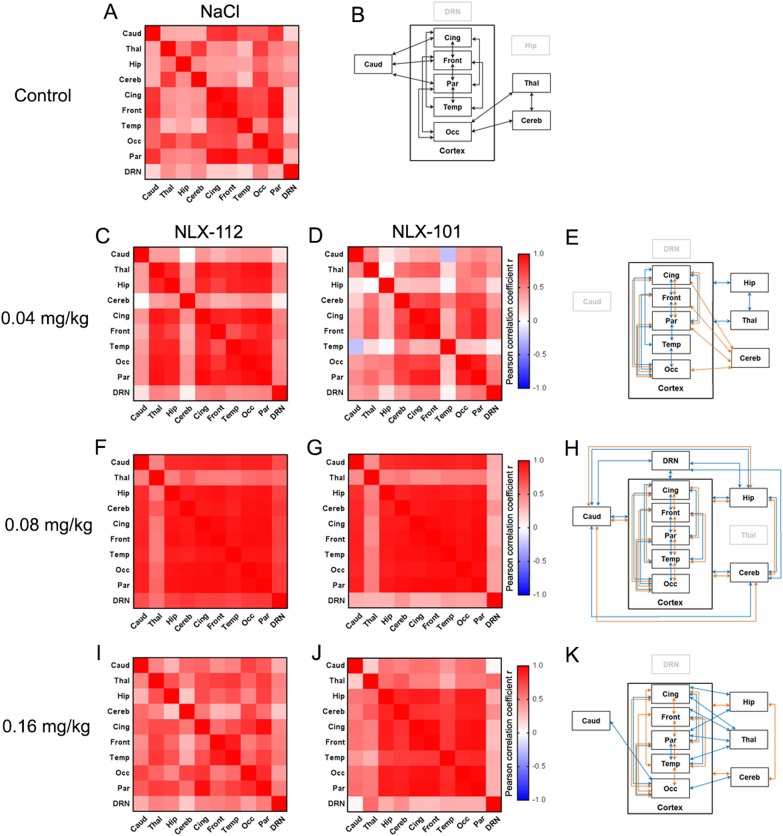
Fig. 5.
Functional connectivity analysis following injection of saline (a, b), NLX-112 at 0.04 mg/kg (c, e), 0.08 mg/kg, (f, h) and 0.16 mg/kg (i, k), or NLX-101 at 0.04 mg/kg (d, e), 0.08 mg/kg (g, h) and 0.16 mg/kg (j, k) in cat brain (n = 4). Correlation matrices are shown in a (saline), c, d (doses of 0.04 mg/kg), f, g (doses of 0.08 mg/kg), i, j (doses of 0.16 mg/kg), with colour bar indicating values of Pearson correlation coefficient r. Graphical representations for each dose are shown in (b) (saline), e (doses of 0.04 mg/kg), h (doses of 0.08 mg/kg) and k (doses of 0.16 mg/kg). Each rectangle corresponds to a region of interest; to simplify the data interpretation, each arrow between two regions corresponds to a value of r > 0.7. Black arrows correspond to the functional connectivity in the saline condition; blue arrows represent the functional connectivity for NLX-112; orange arrows represent the functional connectivity for NLX-101. Cortical regions are grouped in a global region called cortex, in order to facilitate visualisation when a region is functionally connected with all cortical regions

