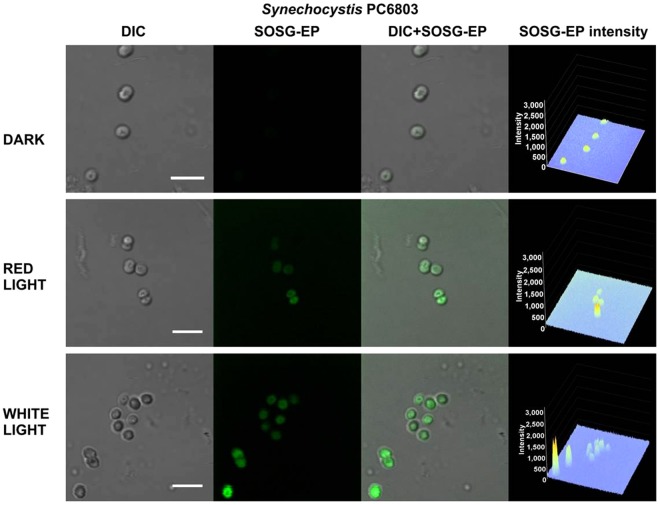
Figure 9.
Effect of red and white light on singlet oxygen imaging in Synechocystis cells. Synechocystis cells were treated in 50 μM SOSG for 30 min at 37 °C either in dark or exposed to red/white light. For each treatment following images are presented (from left to right): Nomarski DIC, SOSG-EP fluorescence (λem = 505–525 nm), combined channel and integral distribution of the signal intensity within the sample (Z-axis represents the levels of brightness for each pixel, ranging between 0 and 3200). Bar represents 5 µm.

