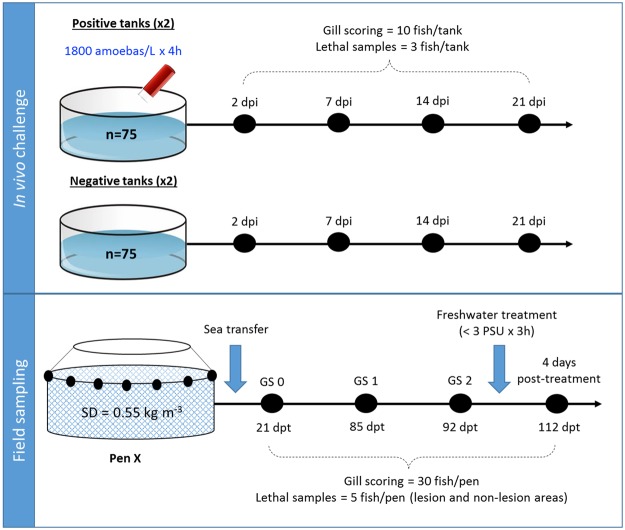
Figure 1.
Schematic representation of the two different trials (in vivo challenge with Neoparamoeba perurans and field sampling) used in this study. SD = initial stocking density. Black dots represent the sequential sampling points (dpi = days post-infection; dpt = days post-transfer). Blue arrows in the field sampling section show initial sea transfer and posterior freshwater treatment. Details on type of lethal samples taken are described in the material and methods section.

