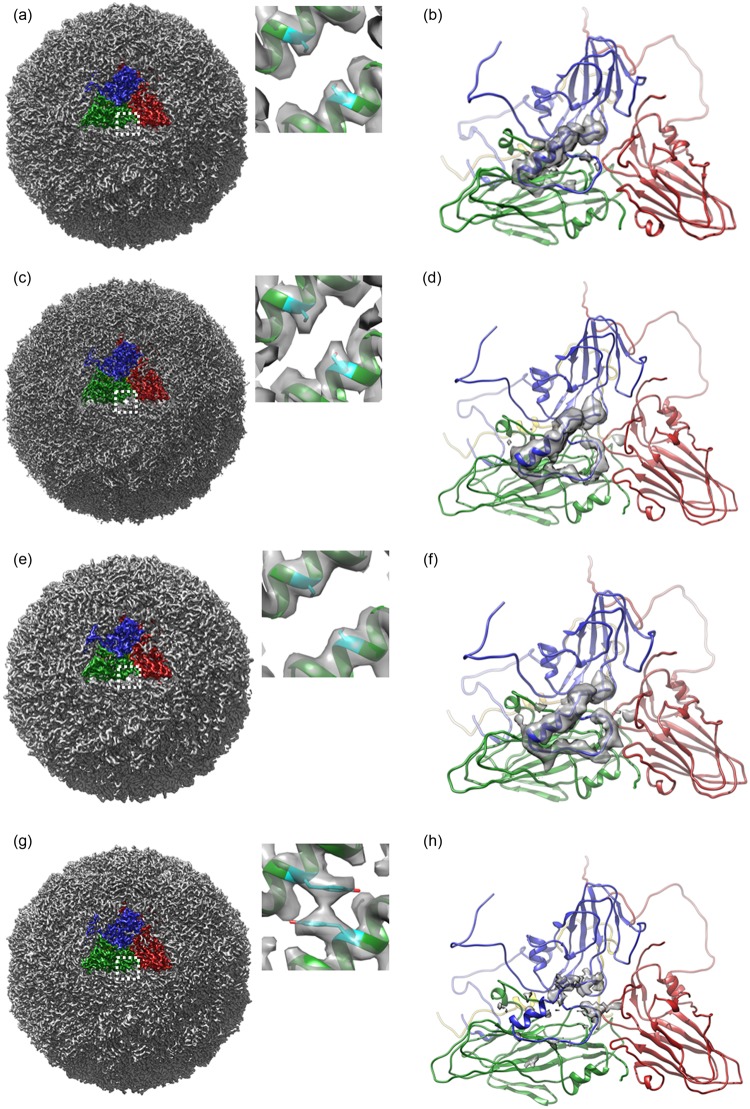
Figure 5.
CryoEM maps and atomic models of the chimeric viruses, (a) a whole virus map of SAT2 wildtype particle. A single protomer is highlighted and coloured as VP1 – blue, VP2 – green and VP3 – red. The inset shows the zoomed-up density of the VP2 alpha-helix at the icosahedral 2-fold axis with a fitted atomic model. The side chain for VP2 residue 93S is shown in stick representation in cyan. (b) Atomic model for SAT2 wildtype. Colouring reflects the different viral proteins, VP1 (blue), VP2 (green), VP3 (red) and VP4 (yellow). The VP1 GH loop is in the down conformation, the associated EM density is shown in grey. (c) and (d) EM electric potential map and atomic model of SAT2/O, depicted as (a) and (b) respectively. (e) and (f) EM electric potential map and associated atomic model of SAT2/O mut2, depicted as (a) and (b) respectively. (g) and (h) EM electric potential map and associated atomic model of ts-SAT2/O, depicted as (a) and (b) respectively. The inset shows the tyrosine sidechain making predicted stacking interactions at the 2-fold axis at position VP2 93. The VP1 GH loop is found to be flexible and hence no density is visible in the EM map.

