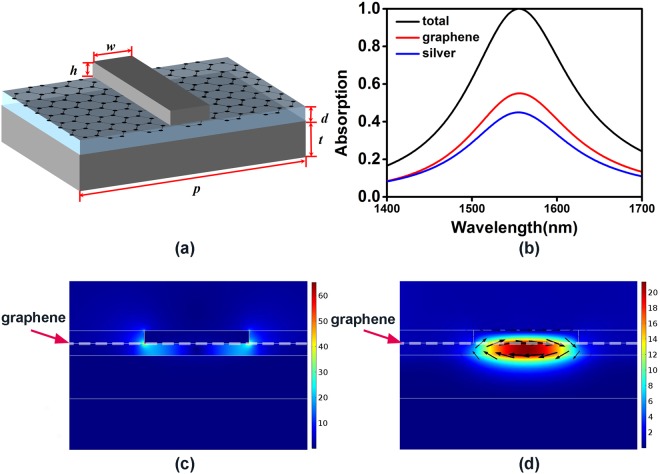
Figure 1.
(a) Schematic of the unit cell of the graphene-based perfect absorption structure using magnetic dipole resonance. (b) Simulated total absorption spectrum and absorption spectra of the monolayer graphene and the metal. The electric and magnetic field distribution of the 1D metal grating structure at the resonant wavelength: (c) Normalized electric field at 1556 nm. (d) Normalized magnetic field at 1556 nm, where the black arrows represent electric displacement. The white dashed line marks the position of graphene in (c) and (d).

