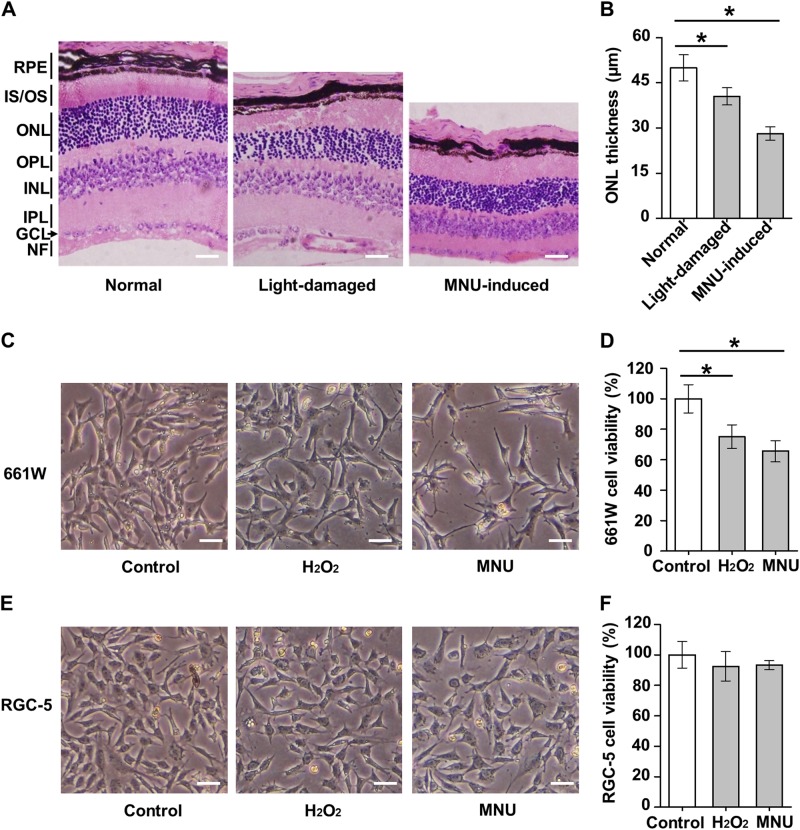
Fig. 1. Responses to retinal damaging factors in retinal tissues and cells.
a, b Representative H&E staining of retinal tissues (a) and statistical analysis of thickness of the outer nuclear layer (ONL, representing photoreceptor cell bodies) (b). Scale bar = 20 μm. N = 4~5 per group. RPE retinal pigment epithelium, IS/OS inner segment/outer segment, OPL outer plexiform layer, INL inner nuclear layer, IPL inner plexiform layer, GCL ganglion cell layer, NF nerve fiber, MNU N-Methyl-N-nitrosourea. c, d Cell morphology (c) and viability analysis (d) by methyl thiazolyl tetrazolium (MTT) of the 661 W photoreceptor cell line. e, f Cell morphology (e) and viability analysis (f) by MTT of the retinal ganglion cell-5 (RGC-5) cell line. Scale bar = 5 μm. N = 3 per group. H2O2, hydrogen peroxide. Data represents mean ± SD. *P < 0.05

