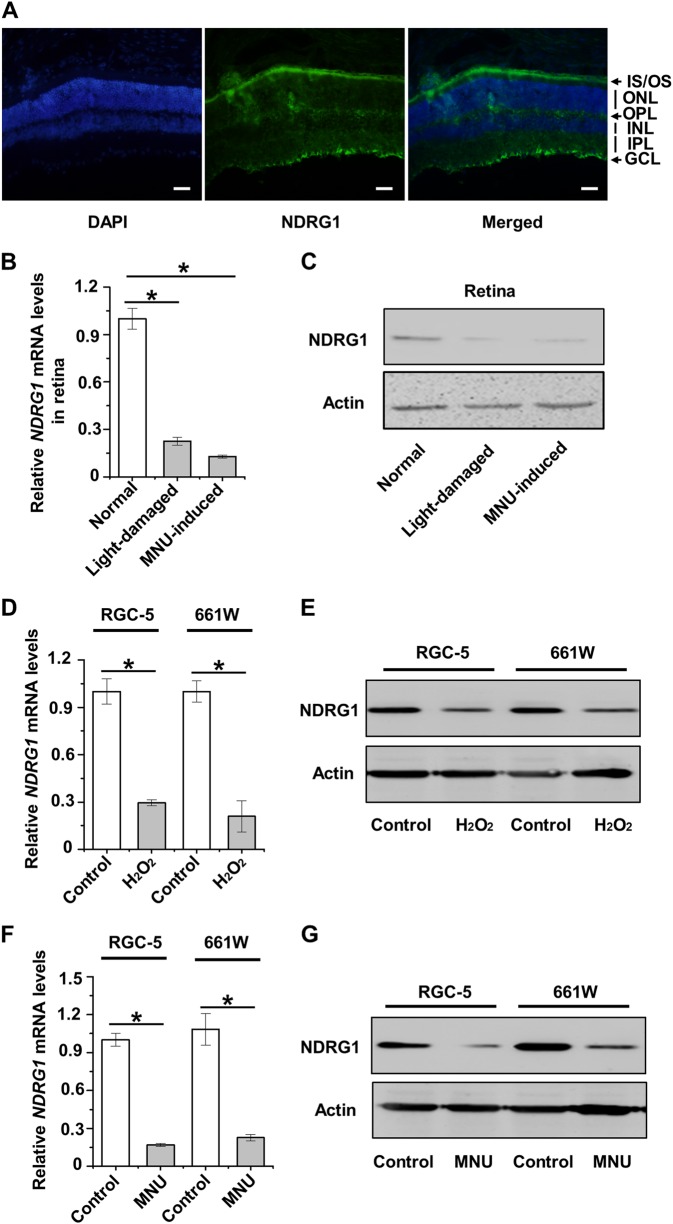
Fig. 2. Involvement of N-myc downstream regulated gene 1 (NDRG1) in retinal damages.
a Immunofluorescent staining of NDRG1 in the retinal tissue. Scale bar = 20 μm. b, c Quantitative real time polymerase chain reaction (qRT-PCR) analysis of the mRNA expression level (b) and western blot analysis of the protein expression level (c) of NDRG1 in the retinal tissue. d–g mRNA and protein expression levels of NDRG1 in the 661 W and RGC-5 cell lines. N = 3 per group. Data represents mean ± SD. *P < 0.05

