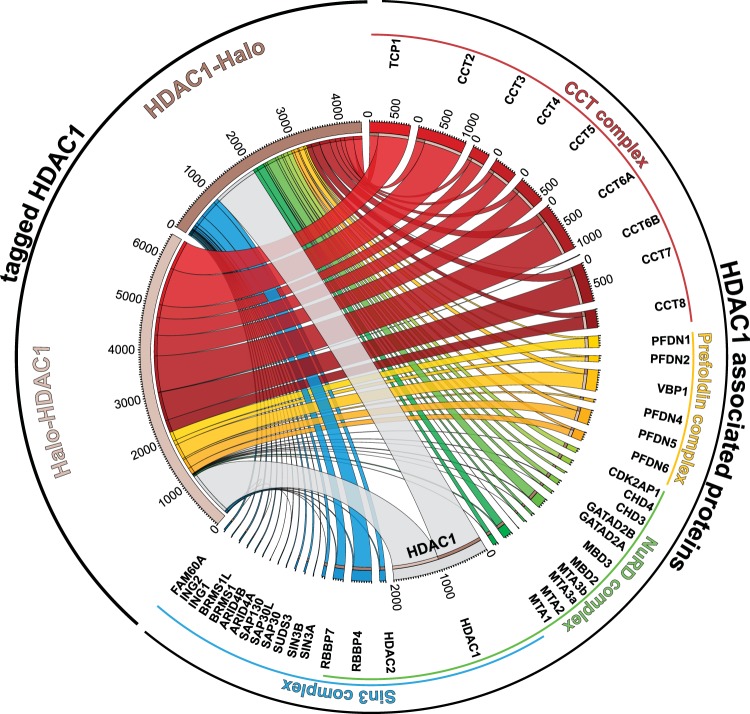
Figure 2.
Quantitative comparison of chaperone/chaperonin and histone deacetylase complexes associated with HeLa cell expressed Halo-HDAC1 and HDAC1-Halo. Components of the complexes CCT (red ribbons), prefoldin (yellow ribbons), NuRD (green ribbons) and Sin3 (blue ribbons) captured by either Halo-HDAC1 or HDAC1-Halo fusion proteins (grey ribbons) were quantitated by calculating dBNSAF values (Supplementary Table S3). Values 1000 x dBNSAF have been visualized using Circos63.

