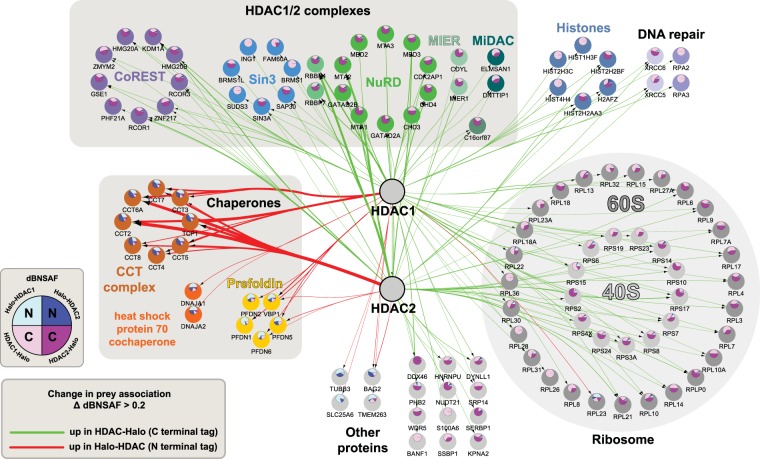
Figure 4.
Rewiring of a HeLa cell HDAC1/2 protein interaction network following Halo affinity tag relocation. Differential network analysis was performed using Diffany36 to compare HDAC1/2 interaction networks resulting from HDAC purifications using either N-terminal or C-terminal Halo affinity tags. Network analysis was performed on the set of proteins significantly enriched with at least one of the bait proteins Halo-HDAC1, Halo-HDAC2, HDAC1-Halo, or HDAC2-Halo (QSPEC log2 FC > 2, QSPEC padj < 0.05, detected > 50% replicates). The differential network highlights changes in values for dBNSAF between Halo-HDAC and HDAC-Halo, with a minimum change of 0.2. The edge width (unbundled regions) is proportional to ΔdBNSAF and the edge color indicates the direction of change (green = increased values in HDAC-Halo samples, red = increased values in Halo-HDAC samples). Pie charts within nodes indicate the relative distribution of dBNSAF values for HDAC1/2 baits using N-terminal tags (blue segments) and using C-terminal tags (pink/purple segments). An expanded explanation of this differential interaction network analysis can be found in Supplementary Figure 3.

