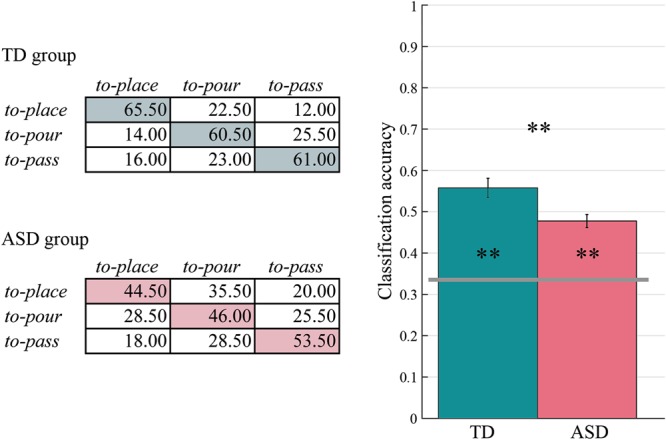
Figure 1.

Prospective control of self-actions. Confusion matrices and classification accuracies for TD and ASD group. The classification accuracy exceeded chance level (0.33; grey horizontal line) in both groups (empirical ps after 500 permutations = 0.002) but was significantly lower in ASD compared to TD group (p < 0.01). Asterisks inside bars indicate significant differences from chance level classification. Asterisk outside bars indicates significant differences between groups (**p < 0.01).
