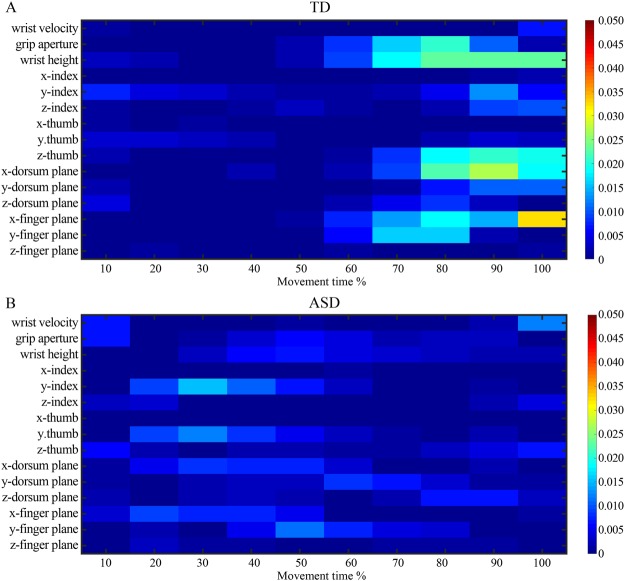
Figure 5.
Discriminative power of kinematic features in TD (A) and ASD (B) group in prospective control of other-actions. The heatmap shows a graphical representation of Fisher scores of kinematic features over time. The higher the Fisher score, the greater the ability of a kinematic feature to discriminate between other-action plans. To allow comparison between groups, Fisher scores were normalized by dividing each score by the sum of all scores obtained in both groups.

