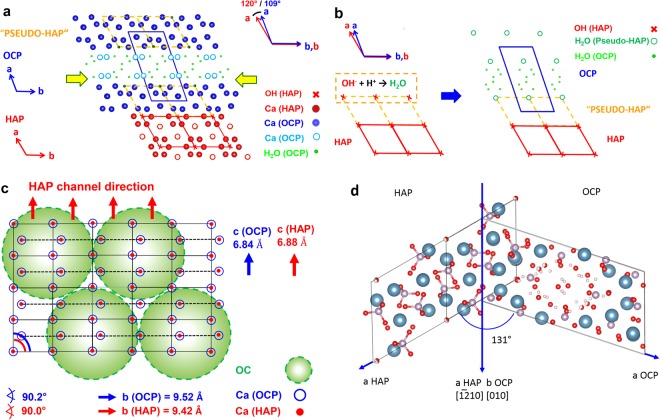
Figure 10.
(a) Structural relations between octacalcium phosphate (OCP, Ca8(HPO4)2(PO4)4 ·5H2O, P-1, a = 19.69 Å, b = 9.52 Å, c = 6.84 Å, α = 90.2 °, β = 92.5 °, γ = 108.9 °)23 and hydroxyapatite (HAP, Ca10(PO4)6(OH)2, P63/m, a = b = 9.42 Å, c = 6.88 Å, α = β = 90.0 °, γ = 120.0 °)23. Projections along c* (OCP) and c (HAP). Atoms restricted to Ca (OCP: blue, HAP: red), H2O (OCP: green), OH (HAP: red cross). Apatite–like layers in OCP (“Pseudo-HAP”) indicated by “unit cells” (broken lines in yellow). The epitaxial relation (100, OCP)/(100, HAP) is close to ideal, see schematic sketch in (b): Distribution of Ca- sites (red/blue) on (100, OCP)/(100, HAP) as present (for instance) on (100, OCP ≙ “pseudo–HAP”) close to the H2O–containing layers of OCP (see yellow arrows in (a)). Green circles: Possible areas (diameter of about 2 nm) for attachment of folded osteocalcin molecules. See TEM images in Figs. 4–7. Ca atoms (HAP, OCP) in plane. (c) Schematic sketch of the epitaxial growth of OCP (blue) on HAP (red) by lowering the pH (<6.5) under the influence of osteocalcin (OC). Formation of H2O molecules by reaction of OH− (from “surface channels” on (100) in the HAP crystal structure) with H+ and local transformation of HAP (red) to “pseudo-HAP” (orange). Restriction to OH− positions in HAP (x, red) and water molecules in “pseudo-HAP” (o, green) as well as H2O–molecules (∙, green) within the water–rich layers in OCP. Projections along c (HAP) and c* (OCP), respectively. (d) The HAP-OCP interface model proposed by Fernandez et al. where [−12–10] HAP coincide with [010] OCP and where the c-HAP-axis is parallel to the c-OCP axis. The angle between a-HAP and a-OCP amounts to 131°.

