Figure 1.
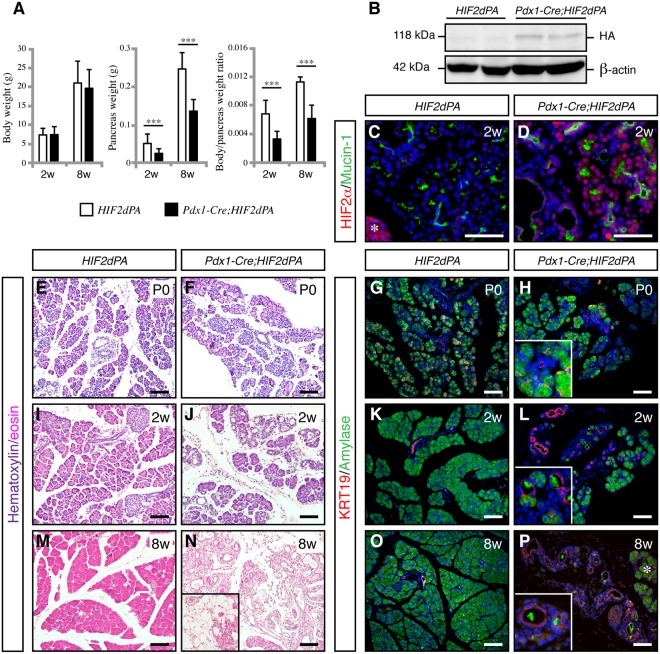
HIF2α stabilization results in exocrine cell atrophy and expansion of duct-like tubular structures. (A) Body weight (left panel), pancreas weight (middle panel) and body/pancreas weight ratio (right panel) in Pdx1-Cre;HIF2dPA and control mice at 2 and 8 weeks of age. Data are presented as mean ± SD. (B) HIF2α accumulation in Pdx1-Cre;HIF2dPA analyzed by Western blot with anti-HA antibody. Two independent two-week-old control and mutant mice are shown. ß-actin protein was used for loading control. Full-length blots are presented in Supplementary Fig. 2. (D) Immunofluorescence analysis of HIF2α in two-week-old control pancreata. Endogenous HIF2α expression is observed in islets (marked by an white asterisk) but not in exocrine tissue. (D) Robust HIF2α accumulation in the pancreas of two-week-old Pdx1-Cre;HIF2dPA mice. Hematoxylin/Eosin-stained pancreatic sections from P0 (E,F), two- (I,J) and eight-week-old (M,N) Pdx1-Cre;HIF2dPA and control mice. Inset in N shows an area with adipose tissue in Pdx1-Cre;HIF2dPA pancreata. Immunofluorescence of amylase and KRT19 shows no differences between Pdx1-Cre;HIF2dPA and control mice at P0 (G,H). Duct-like tubular structures and loss of amylase immunoreactivity in two- (K,L) and eight-week-old (O,P) Pdx1-Cre;HIF2dPA mice compared to control mice. Note areas with normal acini in 8-week-old Pdx1-Cre;HIF2dPA mice (white asterisk in O). Insets in (H,L and P) show higher magnification pictures. DAPI staining is shown in blue in (C,D,G,H,K,L,O and P). Scale bars = 50 µm for (C,D); 100 µm for (E–P). ***P < 0.001.

