Figure 3.
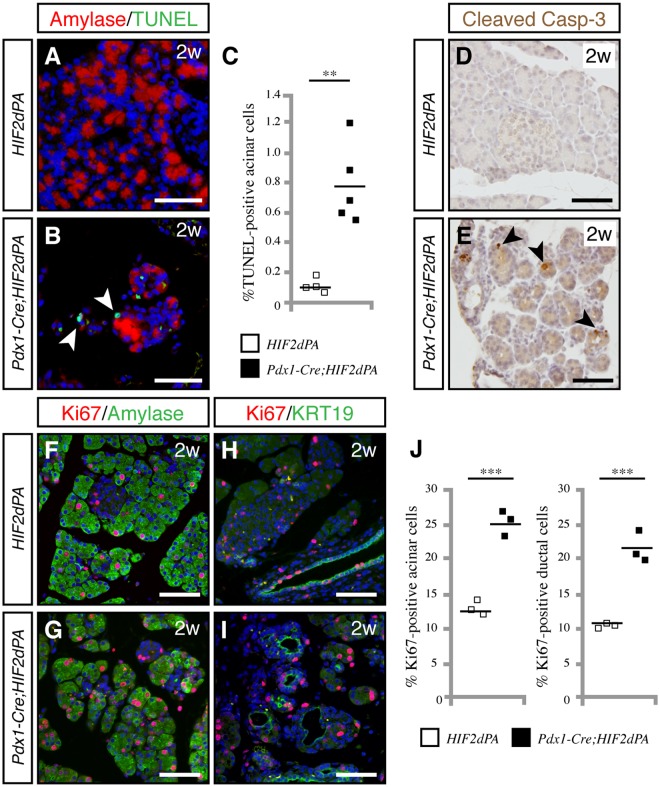
Increased acinar cell apoptosis and proliferation in HIF2α-overexpressing pancreata. (A,B) TUNEL staining shows an increase in apoptotic acinar cells in the pancreas of two-week-old Pdx1-Cre;HIF2dPA mice (B, white arrowheads) compared with wild-type (A) mice. (C) Quantification of apoptotic cells measured as TUNEL positive-cells per total number of amylase-positive cells. Individual data points are presented. The mean value is indicated as a horizontal line. (D,E) Immunohistochemistry for cleaved caspase-3 confirms the increase in apoptotic cells in Pdx1-Cre;HIF2dPA pancreata (E, black arrowheads) compared to control pancreata (D). Increased acinar cell proliferation in two-week-old Pdx1-Cre;HIF2dPA pancreata (G) compared to control pancreata (F), as shown by double amylase/Ki-67 immunofluorescence. Increased ductal cell proliferation in two-week-old Pdx1-Cre;HIF2dPA pancreata (I) compared to control pancreata (H), as shown by double KRT19/Ki-67 immunofluorescence. (J) Quantification of acinar (left graph) and ductal (right graph) proliferating cells, measured as the average number of Ki67-positive cells per amylase- or KRT19-positive cells. Data points represent values for each individual mouse. The mean value is indicated as a horizontal line. Scale bars = 50 µm for A,B,D and E; 100 µm for F–I. **P < 0.01; ***P < 0.001.

