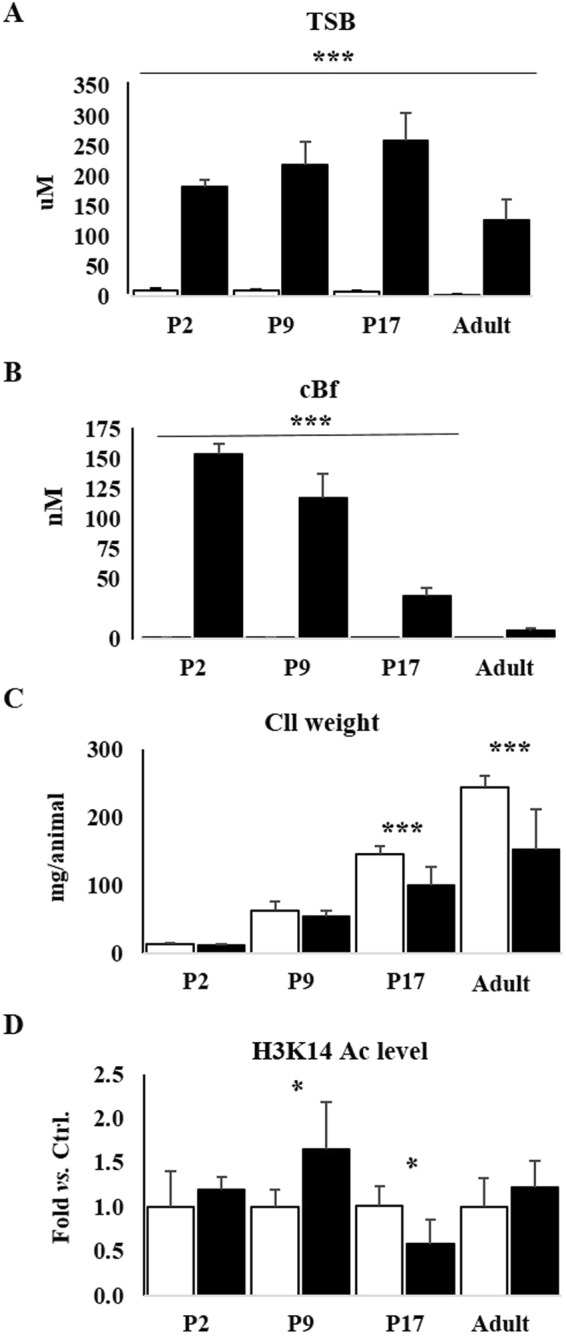
Figure 1.

Total Serum Bilirubin (TSB), calculated free bilirubin (cBf) in the blood, cerebellar weight, and Western blot analysis of the level of histone 3 acetylation (H3K14Ac) P: post-natal age in days, Adult: more than 1-year-old. Black bars jj rats, White bars: ctrls. (A) TSB (µM); (B) cBf (nM), (C) Cll weight (mg/animal). Results are expressed as mean ± S.D. of 6–15 animals each group and post-natal age. One way ANOVA followed by Tukey post-test: ***p < 0.001. (D) H3K14Ac levels in the Cll of jj animals vs. ctrl. Results are as mean ± S.D. of 3–6 animals each group and post-natal age. Unpaired t-test with Welch correction, *p < 0.05 vs. age matched ctrl.
