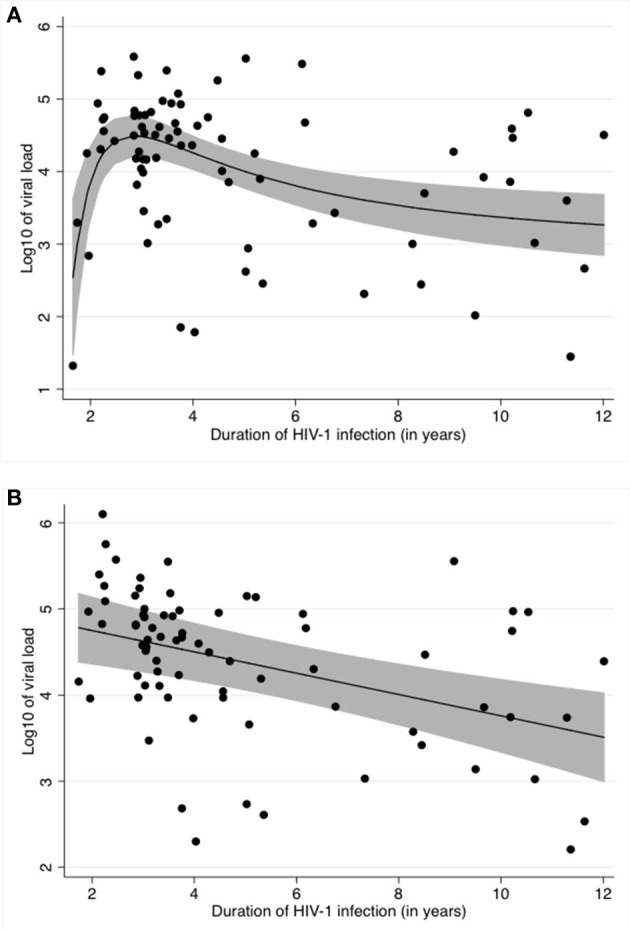
Figure 1.

Relationship between log10 of the viral load and time infected with HIV (A) Unadjusted, (B) Adjusted for Schistosoma status, ln of CAA and CD4 counts. (A) shows the crude relationship between log10 of viral load and duration of HIV-1 infection. A fractional polynomial was fitted to the data. The black line represents the predicted log10 of viral load after applying the resulting function to the data. The grey area represents the 95% confidence limits around the fitted values. The black dots represent the residuals. (B) shows the relationship between log10 of viral load and duration of HIV-1 infection after adjustment for Schistosoma infection status, ln of CAA and CD4 counts using a fractional polynomial. The black line represents the predicted log10 of viral load after applying the resulting function to the data. The grey area represents the 95% confidence limits around the fitted values. The black dots represent the residuals.
