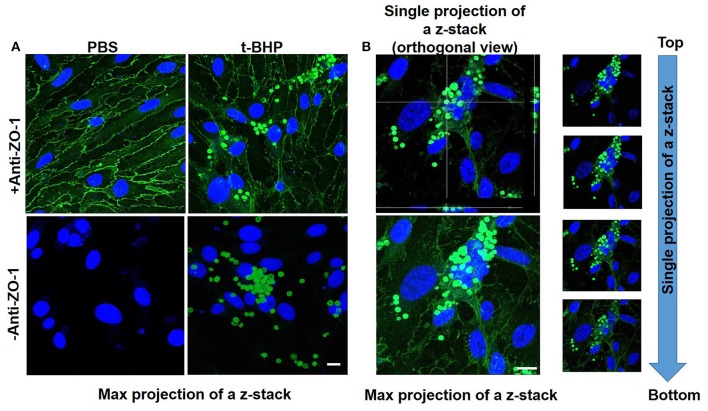
Figure 3.
Confocal microscopy of bEND3 cells and RBC to confirm erythrophagocytosis. Maximum projection of z-stack shows adhesion of t-BHP-treated RBC to bEND3 cells and no adhesion of PBS-treated RBC (Blue = DRAQ5 stain for the endothelial nucleus, green = tight junction ZO-1 protein and autofluorescence of RBC) (A). Orthogonal view of a single projection, maximum projection of a z-stack and individual images of a z-stack moving from top to bottom of a cover glass confirm the internalization of t-BHP-treated RBC by bEND3 cells (B). Scale bar = 10 μm.

