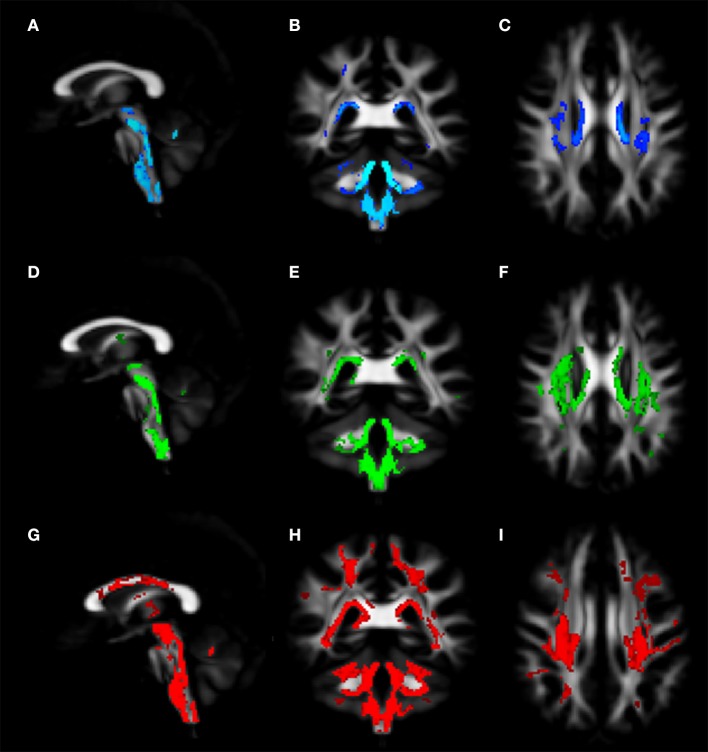
Figure 3.
Voxel-wise analysis of White Matter in FRDA compared to HCs. The figure shows areas of MD increase (A–C), AD increase (D–F), and RD increase (G–I). The distribution of the DTI indexes has been shown in the sagittal view (A,D,G), coronal view (B,E,H), and axial view (C,F,I). FRDA, Freidreich's Ataxia; HCs, healthy controls; MD, mean diffusivity; AD, axial diffusivity; RD, radial diffusivity; DTI, Diffusion Tensor Imaging.

